Profile of the Running ES Score & Positions of GeneSet Members on the Rank Ordered List
| Dataset | set04_transDMpreB_versus_WTpreB |
| Phenotype | NoPhenotypeAvailable |
| Upregulated in class | na_pos |
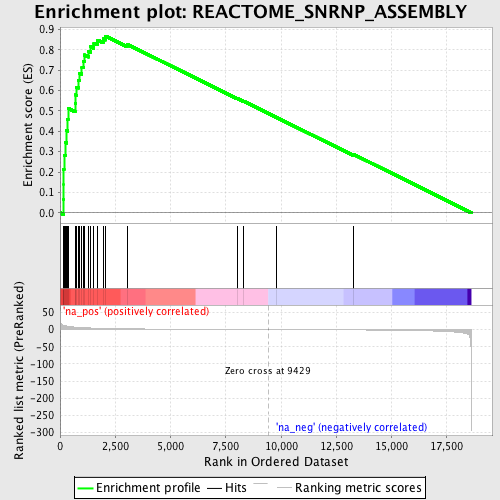
| GeneSet | REACTOME_SNRNP_ASSEMBLY |
| Enrichment Score (ES) | 0.86711687 |
| Normalized Enrichment Score (NES) | 2.299384 |
| Nominal p-value | 0.0 |
| FDR q-value | 0.0 |
| FWER p-Value | 0.0 |
| PROBE | GENE SYMBOL | GENE_TITLE | RANK IN GENE LIST | RANK METRIC SCORE | RUNNING ES | CORE ENRICHMENT | |
|---|---|---|---|---|---|---|---|
| 1 | SNRPF | 151 | 12.568 | 0.0668 | Yes | ||
| 2 | NUP93 | 158 | 12.362 | 0.1401 | Yes | ||
| 3 | PRMT5 | 161 | 12.287 | 0.2133 | Yes | ||
| 4 | NUP43 | 179 | 11.857 | 0.2830 | Yes | ||
| 5 | SNRPD3 | 236 | 10.897 | 0.3450 | Yes | ||
| 6 | NUPL2 | 289 | 10.270 | 0.4034 | Yes | ||
| 7 | RAE1 | 342 | 9.648 | 0.4581 | Yes | ||
| 8 | NUP107 | 365 | 9.417 | 0.5130 | Yes | ||
| 9 | CLNS1A | 682 | 7.103 | 0.5384 | Yes | ||
| 10 | GEMIN4 | 708 | 6.976 | 0.5786 | Yes | ||
| 11 | NUP37 | 746 | 6.784 | 0.6170 | Yes | ||
| 12 | NUP155 | 834 | 6.477 | 0.6510 | Yes | ||
| 13 | NCBP2 | 887 | 6.207 | 0.6852 | Yes | ||
| 14 | SNRPG | 986 | 5.868 | 0.7149 | Yes | ||
| 15 | SNRPD2 | 1061 | 5.582 | 0.7442 | Yes | ||
| 16 | NUP54 | 1098 | 5.452 | 0.7747 | Yes | ||
| 17 | RANBP2 | 1289 | 4.869 | 0.7935 | Yes | ||
| 18 | NUP62 | 1384 | 4.574 | 0.8157 | Yes | ||
| 19 | SIP1 | 1529 | 4.216 | 0.8331 | Yes | ||
| 20 | SNRPB | 1703 | 3.855 | 0.8468 | Yes | ||
| 21 | NUP160 | 1950 | 3.381 | 0.8537 | Yes | ||
| 22 | TPR | 2057 | 3.210 | 0.8671 | Yes | ||
| 23 | SNUPN | 3035 | 2.145 | 0.8273 | No | ||
| 24 | NUP35 | 8007 | 0.356 | 0.5621 | No | ||
| 25 | SNRPE | 8301 | 0.278 | 0.5480 | No | ||
| 26 | NUP153 | 9802 | -0.101 | 0.4679 | No | ||
| 27 | NUP188 | 13273 | -1.040 | 0.2874 | No |
