Profile of the Running ES Score & Positions of GeneSet Members on the Rank Ordered List
| Dataset | set04_transDMpreB_versus_WTpreB |
| Phenotype | NoPhenotypeAvailable |
| Upregulated in class | na_pos |
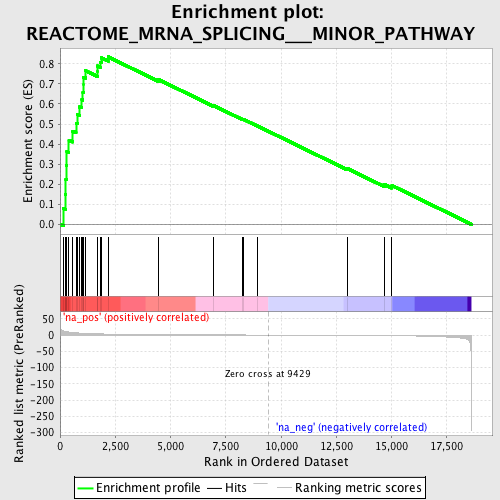
| GeneSet | REACTOME_MRNA_SPLICING___MINOR_PATHWAY |
| Enrichment Score (ES) | 0.8350185 |
| Normalized Enrichment Score (NES) | 2.2570126 |
| Nominal p-value | 0.0 |
| FDR q-value | 0.0 |
| FWER p-Value | 0.0 |
| PROBE | GENE SYMBOL | GENE_TITLE | RANK IN GENE LIST | RANK METRIC SCORE | RUNNING ES | CORE ENRICHMENT | |
|---|---|---|---|---|---|---|---|
| 1 | SNRPF | 151 | 12.568 | 0.0791 | Yes | ||
| 2 | SNRPD3 | 236 | 10.897 | 0.1502 | Yes | ||
| 3 | SFRS6 | 261 | 10.573 | 0.2223 | Yes | ||
| 4 | GTF2F2 | 284 | 10.329 | 0.2928 | Yes | ||
| 5 | EFTUD2 | 306 | 10.035 | 0.3613 | Yes | ||
| 6 | TXNL4A | 401 | 9.146 | 0.4197 | Yes | ||
| 7 | POLR2J | 575 | 7.790 | 0.4645 | Yes | ||
| 8 | SF3B3 | 721 | 6.919 | 0.5047 | Yes | ||
| 9 | POLR2H | 779 | 6.679 | 0.5480 | Yes | ||
| 10 | NCBP2 | 887 | 6.207 | 0.5853 | Yes | ||
| 11 | SNRPG | 986 | 5.868 | 0.6208 | Yes | ||
| 12 | PRPF8 | 1032 | 5.686 | 0.6578 | Yes | ||
| 13 | GTF2F1 | 1058 | 5.591 | 0.6953 | Yes | ||
| 14 | SNRPD2 | 1061 | 5.582 | 0.7339 | Yes | ||
| 15 | POLR2E | 1154 | 5.265 | 0.7655 | Yes | ||
| 16 | SF3B2 | 1697 | 3.869 | 0.7632 | Yes | ||
| 17 | SNRPB | 1703 | 3.855 | 0.7897 | Yes | ||
| 18 | POLR2A | 1817 | 3.619 | 0.8087 | Yes | ||
| 19 | SFRS2 | 1866 | 3.517 | 0.8305 | Yes | ||
| 20 | SFRS1 | 2175 | 3.032 | 0.8350 | Yes | ||
| 21 | POLR2I | 4456 | 1.372 | 0.7219 | No | ||
| 22 | SFRS7 | 6937 | 0.624 | 0.5928 | No | ||
| 23 | POLR2C | 8238 | 0.292 | 0.5249 | No | ||
| 24 | SNRPE | 8301 | 0.278 | 0.5235 | No | ||
| 25 | SF3B4 | 8944 | 0.128 | 0.4898 | No | ||
| 26 | POLR2G | 12990 | -0.941 | 0.2788 | No | ||
| 27 | POLR2B | 14675 | -1.616 | 0.1994 | No | ||
| 28 | SF3B1 | 15019 | -1.809 | 0.1935 | No |
