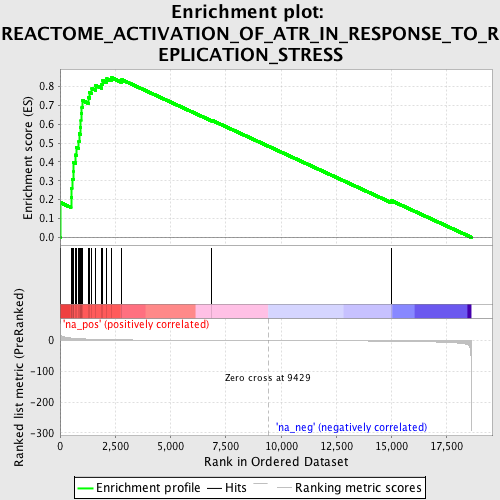
Profile of the Running ES Score & Positions of GeneSet Members on the Rank Ordered List
| Dataset | set04_transDMpreB_versus_WTpreB |
| Phenotype | NoPhenotypeAvailable |
| Upregulated in class | na_pos |
| GeneSet | REACTOME_ACTIVATION_OF_ATR_IN_RESPONSE_TO_REPLICATION_STRESS |
| Enrichment Score (ES) | 0.84700185 |
| Normalized Enrichment Score (NES) | 2.263329 |
| Nominal p-value | 0.0 |
| FDR q-value | 0.0 |
| FWER p-Value | 0.0 |
| PROBE | GENE SYMBOL | GENE_TITLE | RANK IN GENE LIST | RANK METRIC SCORE | RUNNING ES | CORE ENRICHMENT | |
|---|---|---|---|---|---|---|---|
| 1 | MCM6 | 7 | 29.907 | 0.1847 | Yes | ||
| 2 | MCM10 | 493 | 8.389 | 0.2105 | Yes | ||
| 3 | RFC5 | 526 | 8.111 | 0.2590 | Yes | ||
| 4 | ORC1L | 539 | 7.998 | 0.3078 | Yes | ||
| 5 | RPA1 | 599 | 7.604 | 0.3517 | Yes | ||
| 6 | CDC25A | 605 | 7.562 | 0.3983 | Yes | ||
| 7 | MCM7 | 698 | 7.027 | 0.4368 | Yes | ||
| 8 | MCM3 | 731 | 6.865 | 0.4776 | Yes | ||
| 9 | RPA2 | 849 | 6.392 | 0.5108 | Yes | ||
| 10 | RFC4 | 865 | 6.344 | 0.5493 | Yes | ||
| 11 | MCM4 | 931 | 6.051 | 0.5832 | Yes | ||
| 12 | RAD9B | 943 | 6.009 | 0.6198 | Yes | ||
| 13 | MCM5 | 946 | 5.989 | 0.6568 | Yes | ||
| 14 | MCM2 | 987 | 5.859 | 0.6909 | Yes | ||
| 15 | CDC7 | 1012 | 5.780 | 0.7253 | Yes | ||
| 16 | HUS1 | 1296 | 4.845 | 0.7401 | Yes | ||
| 17 | CDK2 | 1330 | 4.747 | 0.7677 | Yes | ||
| 18 | CDC45L | 1439 | 4.404 | 0.7891 | Yes | ||
| 19 | ORC5L | 1613 | 4.030 | 0.8048 | Yes | ||
| 20 | CHEK1 | 1871 | 3.510 | 0.8127 | Yes | ||
| 21 | RPA3 | 1932 | 3.406 | 0.8305 | Yes | ||
| 22 | RAD1 | 2116 | 3.125 | 0.8400 | Yes | ||
| 23 | ORC2L | 2314 | 2.841 | 0.8470 | Yes | ||
| 24 | RFC3 | 2794 | 2.354 | 0.8358 | No | ||
| 25 | CDC25C | 6868 | 0.643 | 0.6207 | No | ||
| 26 | ORC4L | 15008 | -1.805 | 0.1941 | No |
