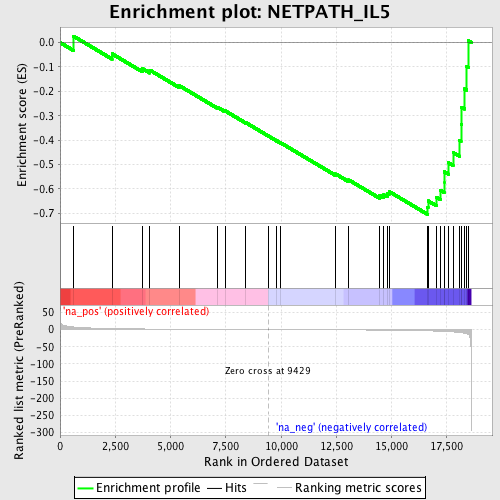
Profile of the Running ES Score & Positions of GeneSet Members on the Rank Ordered List
| Dataset | set04_transDMpreB_versus_WTpreB |
| Phenotype | NoPhenotypeAvailable |
| Upregulated in class | na_neg |
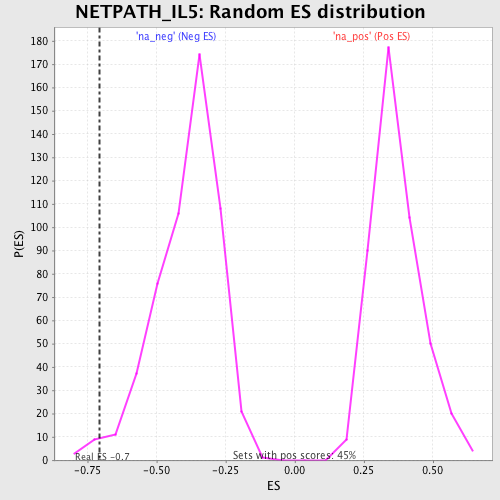
| GeneSet | NETPATH_IL5 |
| Enrichment Score (ES) | -0.7047362 |
| Normalized Enrichment Score (NES) | -1.8144183 |
| Nominal p-value | 0.016483517 |
| FDR q-value | 0.4663377 |
| FWER p-Value | 0.994 |
| PROBE | GENE SYMBOL | GENE_TITLE | RANK IN GENE LIST | RANK METRIC SCORE | RUNNING ES | CORE ENRICHMENT | |
|---|---|---|---|---|---|---|---|
| 1 | BAX | 601 | 7.598 | 0.0264 | No | ||
| 2 | YWHAZ | 2351 | 2.792 | -0.0461 | No | ||
| 3 | IL5 | 3717 | 1.698 | -0.1064 | No | ||
| 4 | RAPGEF1 | 4062 | 1.529 | -0.1130 | No | ||
| 5 | MAP2K2 | 5396 | 1.043 | -0.1767 | No | ||
| 6 | MBP | 7126 | 0.578 | -0.2653 | No | ||
| 7 | UNC119 | 7471 | 0.492 | -0.2800 | No | ||
| 8 | STAT5A | 8412 | 0.253 | -0.3286 | No | ||
| 9 | IL5RA | 9428 | 0.000 | -0.3832 | No | ||
| 10 | LYN | 9815 | -0.105 | -0.4031 | No | ||
| 11 | STAT5B | 9990 | -0.149 | -0.4113 | No | ||
| 12 | JAK1 | 12469 | -0.788 | -0.5386 | No | ||
| 13 | PTPN11 | 13063 | -0.961 | -0.5631 | No | ||
| 14 | BTK | 14460 | -1.507 | -0.6265 | No | ||
| 15 | PRKCD | 14653 | -1.601 | -0.6245 | No | ||
| 16 | RAF1 | 14806 | -1.685 | -0.6196 | No | ||
| 17 | SHC1 | 14889 | -1.736 | -0.6106 | No | ||
| 18 | GRB2 | 16640 | -3.636 | -0.6766 | Yes | ||
| 19 | JAK2 | 16656 | -3.667 | -0.6490 | Yes | ||
| 20 | DNM2 | 17034 | -4.498 | -0.6345 | Yes | ||
| 21 | CRKL | 17222 | -5.001 | -0.6059 | Yes | ||
| 22 | NFKB1 | 17383 | -5.487 | -0.5721 | Yes | ||
| 23 | SDCBP | 17387 | -5.502 | -0.5297 | Yes | ||
| 24 | HCK | 17570 | -6.125 | -0.4921 | Yes | ||
| 25 | MAPK1 | 17787 | -6.868 | -0.4506 | Yes | ||
| 26 | SYK | 18076 | -8.451 | -0.4007 | Yes | ||
| 27 | PIK3CG | 18147 | -9.020 | -0.3347 | Yes | ||
| 28 | SOCS1 | 18162 | -9.161 | -0.2646 | Yes | ||
| 29 | SOX4 | 18311 | -10.671 | -0.1900 | Yes | ||
| 30 | KRAS | 18407 | -12.449 | -0.0988 | Yes | ||
| 31 | PTK2B | 18476 | -14.219 | 0.0075 | Yes |