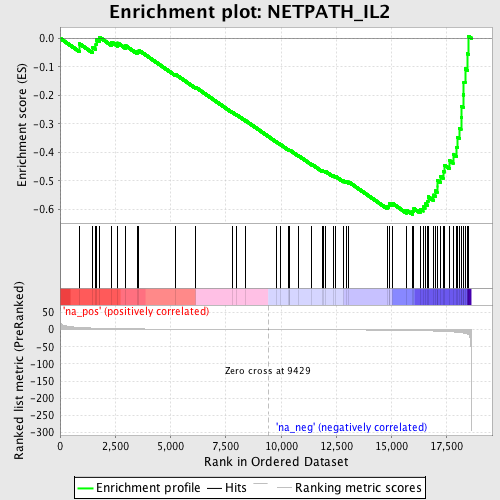
Profile of the Running ES Score & Positions of GeneSet Members on the Rank Ordered List
| Dataset | set04_transDMpreB_versus_WTpreB |
| Phenotype | NoPhenotypeAvailable |
| Upregulated in class | na_neg |
| GeneSet | NETPATH_IL2 |
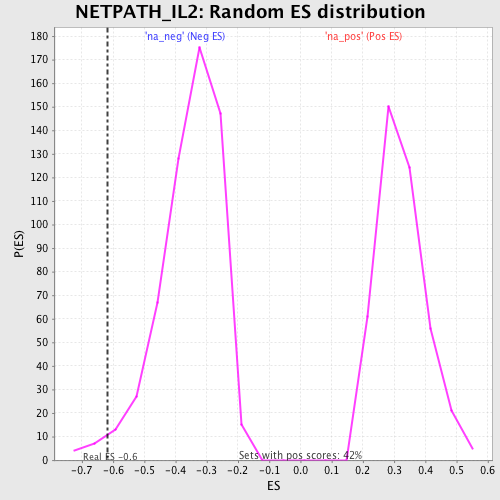
| Enrichment Score (ES) | -0.6178981 |
| Normalized Enrichment Score (NES) | -1.7401049 |
| Nominal p-value | 0.02058319 |
| FDR q-value | 0.38657668 |
| FWER p-Value | 1.0 |
| PROBE | GENE SYMBOL | GENE_TITLE | RANK IN GENE LIST | RANK METRIC SCORE | RUNNING ES | CORE ENRICHMENT | |
|---|---|---|---|---|---|---|---|
| 1 | PIK3CB | 882 | 6.246 | -0.0195 | No | ||
| 2 | PIK3R3 | 1472 | 4.347 | -0.0318 | No | ||
| 3 | BCL2 | 1621 | 4.010 | -0.0218 | No | ||
| 4 | FRAP1 | 1652 | 3.947 | -0.0057 | No | ||
| 5 | RPS6KB1 | 1785 | 3.698 | 0.0037 | No | ||
| 6 | CRK | 2332 | 2.817 | -0.0131 | No | ||
| 7 | PRKCZ | 2606 | 2.511 | -0.0166 | No | ||
| 8 | AKT1 | 2974 | 2.198 | -0.0265 | No | ||
| 9 | INSL3 | 3488 | 1.823 | -0.0460 | No | ||
| 10 | IL2RB | 3569 | 1.778 | -0.0423 | No | ||
| 11 | GNB2L1 | 5218 | 1.102 | -0.1262 | No | ||
| 12 | SHB | 6132 | 0.830 | -0.1717 | No | ||
| 13 | PLCB1 | 7808 | 0.401 | -0.2601 | No | ||
| 14 | PIK3R2 | 7997 | 0.358 | -0.2687 | No | ||
| 15 | STAT5A | 8412 | 0.253 | -0.2898 | No | ||
| 16 | LYN | 9815 | -0.105 | -0.3649 | No | ||
| 17 | STAT5B | 9990 | -0.149 | -0.3736 | No | ||
| 18 | SOS1 | 10324 | -0.226 | -0.3906 | No | ||
| 19 | CBL | 10381 | -0.236 | -0.3925 | No | ||
| 20 | JAK3 | 10399 | -0.239 | -0.3924 | No | ||
| 21 | SOCS3 | 10804 | -0.334 | -0.4126 | No | ||
| 22 | FOXO3 | 11398 | -0.483 | -0.4424 | No | ||
| 23 | PIK3R1 | 11865 | -0.608 | -0.4648 | No | ||
| 24 | IL2RG | 11934 | -0.628 | -0.4657 | No | ||
| 25 | NMI | 12032 | -0.656 | -0.4680 | No | ||
| 26 | IRS1 | 12354 | -0.755 | -0.4819 | No | ||
| 27 | JAK1 | 12469 | -0.788 | -0.4845 | No | ||
| 28 | ETS2 | 12832 | -0.896 | -0.5000 | No | ||
| 29 | GAB2 | 12943 | -0.928 | -0.5018 | No | ||
| 30 | PTPN11 | 13063 | -0.961 | -0.5039 | No | ||
| 31 | RAF1 | 14806 | -1.685 | -0.5902 | No | ||
| 32 | IL2 | 14885 | -1.734 | -0.5866 | No | ||
| 33 | SHC1 | 14889 | -1.736 | -0.5790 | No | ||
| 34 | NGFR | 15055 | -1.828 | -0.5797 | No | ||
| 35 | CISH | 15674 | -2.315 | -0.6026 | No | ||
| 36 | ICAM1 | 15958 | -2.602 | -0.6062 | Yes | ||
| 37 | ETS1 | 16011 | -2.677 | -0.5970 | Yes | ||
| 38 | FYN | 16296 | -3.029 | -0.5988 | Yes | ||
| 39 | PIK3CA | 16426 | -3.246 | -0.5912 | Yes | ||
| 40 | STAM2 | 16517 | -3.410 | -0.5808 | Yes | ||
| 41 | GRB2 | 16640 | -3.636 | -0.5710 | Yes | ||
| 42 | JAK2 | 16656 | -3.667 | -0.5554 | Yes | ||
| 43 | STAM | 16889 | -4.107 | -0.5495 | Yes | ||
| 44 | LCK | 16984 | -4.337 | -0.5352 | Yes | ||
| 45 | NR3C1 | 17064 | -4.576 | -0.5189 | Yes | ||
| 46 | RELA | 17065 | -4.586 | -0.4984 | Yes | ||
| 47 | CRKL | 17222 | -5.001 | -0.4844 | Yes | ||
| 48 | MAPK3 | 17335 | -5.344 | -0.4664 | Yes | ||
| 49 | NFKB1 | 17383 | -5.487 | -0.4444 | Yes | ||
| 50 | IL2RA | 17631 | -6.321 | -0.4294 | Yes | ||
| 51 | MAPK1 | 17787 | -6.868 | -0.4070 | Yes | ||
| 52 | STAT3 | 17952 | -7.686 | -0.3814 | Yes | ||
| 53 | CD53 | 17986 | -7.827 | -0.3481 | Yes | ||
| 54 | SYK | 18076 | -8.451 | -0.3150 | Yes | ||
| 55 | PIK3CG | 18147 | -9.020 | -0.2784 | Yes | ||
| 56 | SOCS1 | 18162 | -9.161 | -0.2381 | Yes | ||
| 57 | STAT1 | 18246 | -9.978 | -0.1978 | Yes | ||
| 58 | IL15 | 18273 | -10.175 | -0.1536 | Yes | ||
| 59 | ITM2B | 18331 | -11.073 | -0.1071 | Yes | ||
| 60 | PTPN6 | 18441 | -13.086 | -0.0543 | Yes | ||
| 61 | PTK2B | 18476 | -14.219 | 0.0075 | Yes |