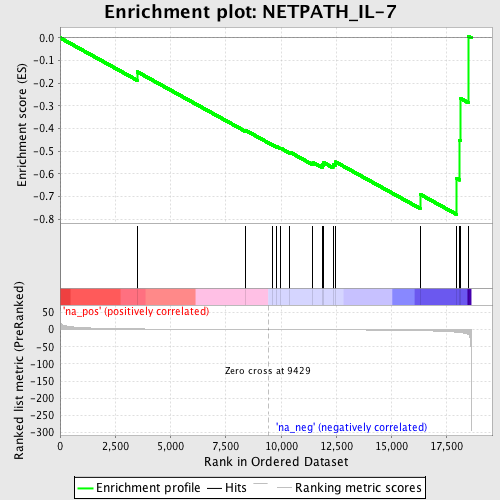
Profile of the Running ES Score & Positions of GeneSet Members on the Rank Ordered List
| Dataset | set04_transDMpreB_versus_WTpreB |
| Phenotype | NoPhenotypeAvailable |
| Upregulated in class | na_neg |
| GeneSet | NETPATH_IL-7 |
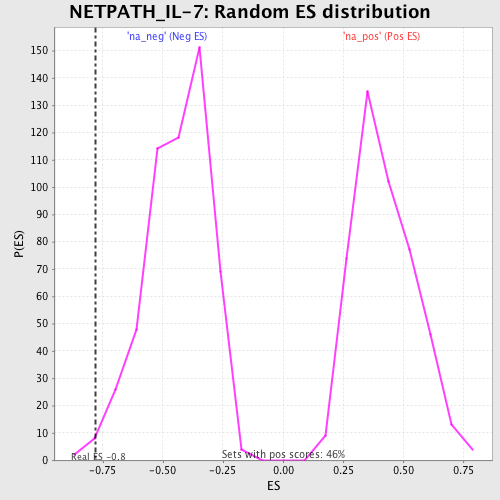
| Enrichment Score (ES) | -0.77987546 |
| Normalized Enrichment Score (NES) | -1.7795006 |
| Nominal p-value | 0.009259259 |
| FDR q-value | 0.3865594 |
| FWER p-Value | 0.998 |
| PROBE | GENE SYMBOL | GENE_TITLE | RANK IN GENE LIST | RANK METRIC SCORE | RUNNING ES | CORE ENRICHMENT | |
|---|---|---|---|---|---|---|---|
| 1 | INSL3 | 3488 | 1.823 | -0.1498 | No | ||
| 2 | STAT5A | 8412 | 0.253 | -0.4092 | No | ||
| 3 | BCL2L11 | 9608 | -0.049 | -0.4724 | No | ||
| 4 | LYN | 9815 | -0.105 | -0.4814 | No | ||
| 5 | STAT5B | 9990 | -0.149 | -0.4876 | No | ||
| 6 | JAK3 | 10399 | -0.239 | -0.5046 | No | ||
| 7 | IL7 | 11444 | -0.495 | -0.5505 | No | ||
| 8 | PIK3R1 | 11865 | -0.608 | -0.5605 | No | ||
| 9 | IL2RG | 11934 | -0.628 | -0.5512 | No | ||
| 10 | IRS1 | 12354 | -0.755 | -0.5581 | No | ||
| 11 | JAK1 | 12469 | -0.788 | -0.5479 | No | ||
| 12 | FYN | 16296 | -3.029 | -0.6909 | Yes | ||
| 13 | STAT3 | 17952 | -7.686 | -0.6208 | Yes | ||
| 14 | MCL1 | 18083 | -8.510 | -0.4517 | Yes | ||
| 15 | IL7R | 18135 | -8.992 | -0.2684 | Yes | ||
| 16 | PTK2B | 18476 | -14.219 | 0.0075 | Yes |