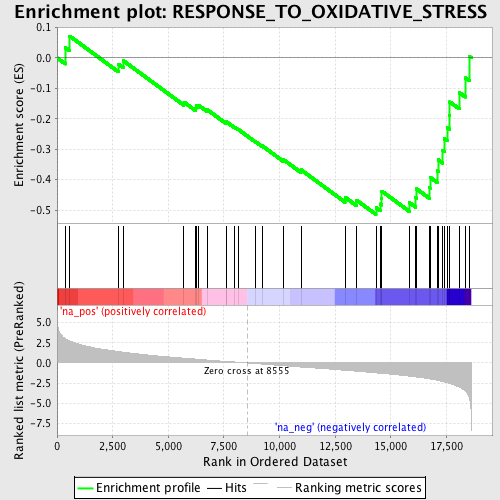
Profile of the Running ES Score & Positions of GeneSet Members on the Rank Ordered List
| Dataset | set04_transDMpreB_versus_DMpreB |
| Phenotype | NoPhenotypeAvailable |
| Upregulated in class | na_neg |
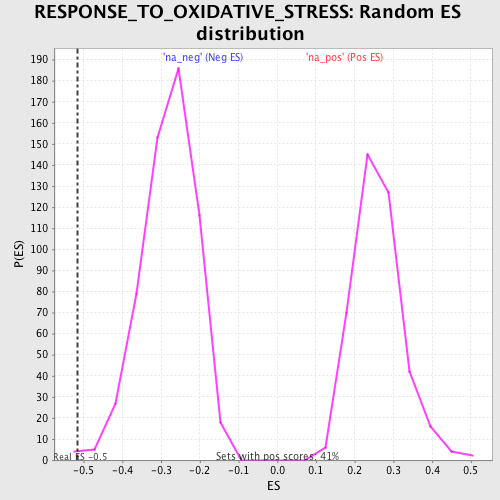
| GeneSet | RESPONSE_TO_OXIDATIVE_STRESS |
| Enrichment Score (ES) | -0.51454055 |
| Normalized Enrichment Score (NES) | -1.8346778 |
| Nominal p-value | 0.0051020407 |
| FDR q-value | 0.06344681 |
| FWER p-Value | 0.671 |
| PROBE | GENE SYMBOL | GENE_TITLE | RANK IN GENE LIST | RANK METRIC SCORE | RUNNING ES | CORE ENRICHMENT | |
|---|---|---|---|---|---|---|---|
| 1 | ERCC2 | 372 | 3.000 | 0.0334 | No | ||
| 2 | PDLIM1 | 568 | 2.733 | 0.0717 | No | ||
| 3 | GCLC | 2758 | 1.406 | -0.0211 | No | ||
| 4 | TXNRD2 | 2968 | 1.330 | -0.0086 | No | ||
| 5 | PNKP | 5701 | 0.592 | -0.1451 | No | ||
| 6 | CCL5 | 6229 | 0.475 | -0.1651 | No | ||
| 7 | STK25 | 6244 | 0.471 | -0.1574 | No | ||
| 8 | SCARA3 | 6372 | 0.441 | -0.1564 | No | ||
| 9 | SOD2 | 6745 | 0.359 | -0.1700 | No | ||
| 10 | GPX3 | 7597 | 0.184 | -0.2125 | No | ||
| 11 | CYGB | 7605 | 0.184 | -0.2096 | No | ||
| 12 | MPO | 7968 | 0.113 | -0.2271 | No | ||
| 13 | GCLM | 8150 | 0.082 | -0.2354 | No | ||
| 14 | SEPP1 | 8914 | -0.073 | -0.2751 | No | ||
| 15 | NDUFA6 | 9214 | -0.139 | -0.2888 | No | ||
| 16 | PRNP | 10160 | -0.341 | -0.3336 | No | ||
| 17 | APOA4 | 10965 | -0.509 | -0.3678 | No | ||
| 18 | SGK2 | 12942 | -0.909 | -0.4579 | No | ||
| 19 | ATOX1 | 13462 | -1.022 | -0.4677 | No | ||
| 20 | NDUFS8 | 14334 | -1.229 | -0.4926 | Yes | ||
| 21 | GSS | 14522 | -1.274 | -0.4800 | Yes | ||
| 22 | MSRA | 14588 | -1.289 | -0.4605 | Yes | ||
| 23 | PRDX5 | 14596 | -1.290 | -0.4379 | Yes | ||
| 24 | NUDT1 | 15824 | -1.633 | -0.4749 | Yes | ||
| 25 | NDUFB4 | 16118 | -1.738 | -0.4596 | Yes | ||
| 26 | SRXN1 | 16157 | -1.753 | -0.4304 | Yes | ||
| 27 | PRDX6 | 16743 | -1.981 | -0.4266 | Yes | ||
| 28 | SOD1 | 16765 | -1.988 | -0.3923 | Yes | ||
| 29 | NDUFS2 | 17085 | -2.153 | -0.3711 | Yes | ||
| 30 | DUSP1 | 17135 | -2.182 | -0.3349 | Yes | ||
| 31 | RNF7 | 17338 | -2.318 | -0.3044 | Yes | ||
| 32 | APTX | 17402 | -2.367 | -0.2656 | Yes | ||
| 33 | GLRX2 | 17534 | -2.442 | -0.2292 | Yes | ||
| 34 | ERCC1 | 17624 | -2.531 | -0.1888 | Yes | ||
| 35 | ERCC3 | 17651 | -2.555 | -0.1447 | Yes | ||
| 36 | PRDX2 | 18082 | -3.008 | -0.1142 | Yes | ||
| 37 | DHCR24 | 18349 | -3.529 | -0.0657 | Yes | ||
| 38 | ERCC8 | 18539 | -4.488 | 0.0041 | Yes |