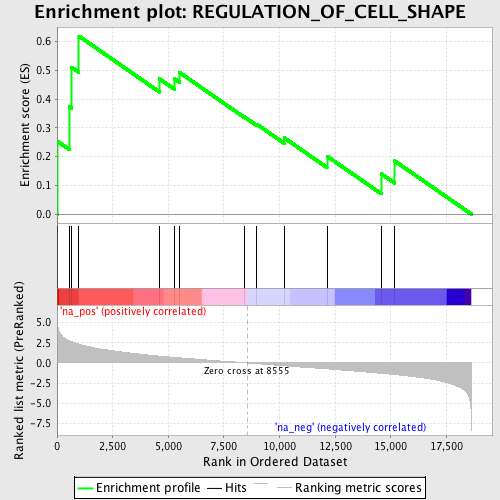
Profile of the Running ES Score & Positions of GeneSet Members on the Rank Ordered List
| Dataset | set04_transDMpreB_versus_DMpreB |
| Phenotype | NoPhenotypeAvailable |
| Upregulated in class | na_pos |
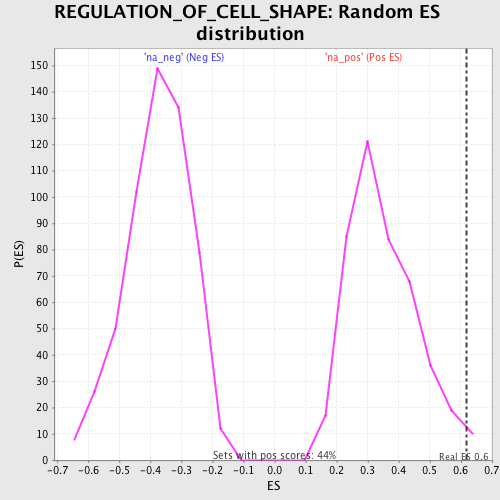
| GeneSet | REGULATION_OF_CELL_SHAPE |
| Enrichment Score (ES) | 0.61942446 |
| Normalized Enrichment Score (NES) | 1.7629198 |
| Nominal p-value | 0.018181818 |
| FDR q-value | 0.82402635 |
| FWER p-Value | 0.94 |
| PROBE | GENE SYMBOL | GENE_TITLE | RANK IN GENE LIST | RANK METRIC SCORE | RUNNING ES | CORE ENRICHMENT | |
|---|---|---|---|---|---|---|---|
| 1 | FGD2 | 24 | 4.704 | 0.2530 | Yes | ||
| 2 | CDC42EP1 | 548 | 2.755 | 0.3738 | Yes | ||
| 3 | MYH9 | 644 | 2.638 | 0.5113 | Yes | ||
| 4 | CENTD2 | 981 | 2.334 | 0.6194 | Yes | ||
| 5 | CDC42EP2 | 4602 | 0.845 | 0.4705 | No | ||
| 6 | CDC42EP5 | 5287 | 0.679 | 0.4705 | No | ||
| 7 | FGD3 | 5508 | 0.629 | 0.4927 | No | ||
| 8 | FGD6 | 8411 | 0.031 | 0.3384 | No | ||
| 9 | FGD1 | 8965 | -0.084 | 0.3132 | No | ||
| 10 | CDC42EP4 | 10202 | -0.351 | 0.2658 | No | ||
| 11 | TAOK2 | 12133 | -0.732 | 0.2016 | No | ||
| 12 | FGD5 | 14565 | -1.285 | 0.1404 | No | ||
| 13 | FGD4 | 15170 | -1.430 | 0.1852 | No |