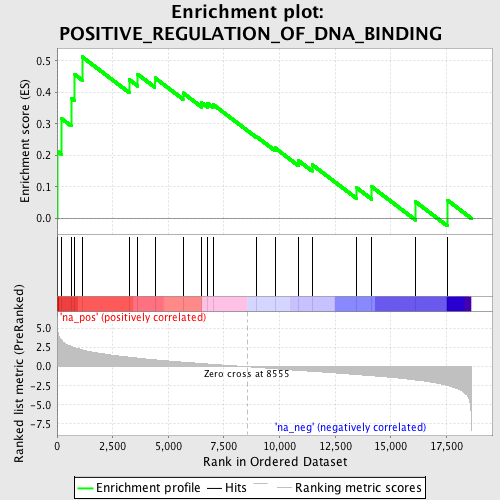
Profile of the Running ES Score & Positions of GeneSet Members on the Rank Ordered List
| Dataset | set04_transDMpreB_versus_DMpreB |
| Phenotype | NoPhenotypeAvailable |
| Upregulated in class | na_pos |
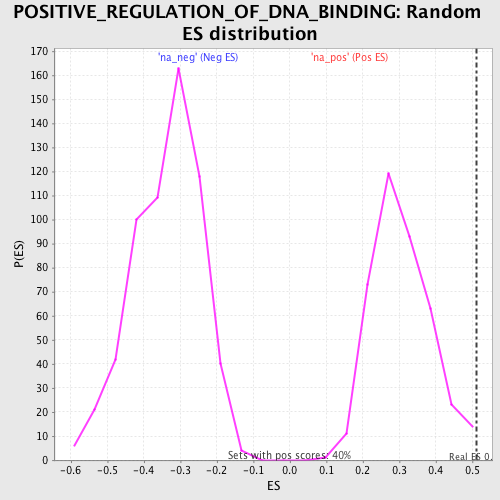
| GeneSet | POSITIVE_REGULATION_OF_DNA_BINDING |
| Enrichment Score (ES) | 0.5128583 |
| Normalized Enrichment Score (NES) | 1.6848401 |
| Nominal p-value | 0.005037783 |
| FDR q-value | 0.623364 |
| FWER p-Value | 0.998 |
| PROBE | GENE SYMBOL | GENE_TITLE | RANK IN GENE LIST | RANK METRIC SCORE | RUNNING ES | CORE ENRICHMENT | |
|---|---|---|---|---|---|---|---|
| 1 | CARD11 | 1 | 6.382 | 0.2135 | Yes | ||
| 2 | CAMK2A | 208 | 3.401 | 0.3162 | Yes | ||
| 3 | ERC1 | 634 | 2.654 | 0.3821 | Yes | ||
| 4 | IKBKB | 798 | 2.484 | 0.4565 | Yes | ||
| 5 | NOD2 | 1126 | 2.210 | 0.5129 | Yes | ||
| 6 | PYCARD | 3242 | 1.241 | 0.4406 | No | ||
| 7 | RELA | 3628 | 1.116 | 0.4573 | No | ||
| 8 | UBE2V1 | 4399 | 0.899 | 0.4460 | No | ||
| 9 | EDA2R | 5661 | 0.599 | 0.3982 | No | ||
| 10 | TNF | 6499 | 0.413 | 0.3670 | No | ||
| 11 | EDA | 6768 | 0.355 | 0.3645 | No | ||
| 12 | NME1 | 7010 | 0.302 | 0.3616 | No | ||
| 13 | NPM1 | 8957 | -0.083 | 0.2598 | No | ||
| 14 | PRKCQ | 9793 | -0.264 | 0.2237 | No | ||
| 15 | EDF1 | 10840 | -0.482 | 0.1836 | No | ||
| 16 | JMY | 11460 | -0.607 | 0.1706 | No | ||
| 17 | PRDX3 | 13472 | -1.024 | 0.0968 | No | ||
| 18 | UBE2N | 14144 | -1.183 | 0.1002 | No | ||
| 19 | BCL10 | 16112 | -1.737 | 0.0526 | No | ||
| 20 | MAP3K13 | 17541 | -2.451 | 0.0578 | No |