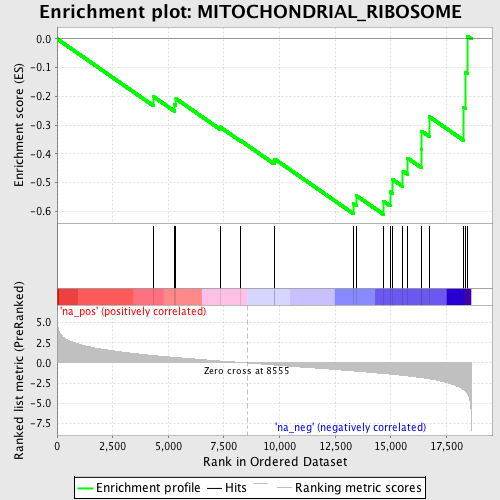
Profile of the Running ES Score & Positions of GeneSet Members on the Rank Ordered List
| Dataset | set04_transDMpreB_versus_DMpreB |
| Phenotype | NoPhenotypeAvailable |
| Upregulated in class | na_neg |
| GeneSet | MITOCHONDRIAL_RIBOSOME |
| Enrichment Score (ES) | -0.6104727 |
| Normalized Enrichment Score (NES) | -1.8502866 |
| Nominal p-value | 0.0016638935 |
| FDR q-value | 0.06473087 |
| FWER p-Value | 0.602 |
| PROBE | GENE SYMBOL | GENE_TITLE | RANK IN GENE LIST | RANK METRIC SCORE | RUNNING ES | CORE ENRICHMENT | |
|---|---|---|---|---|---|---|---|
| 1 | MRPS22 | 4324 | 0.920 | -0.2003 | No | ||
| 2 | MRPS15 | 5284 | 0.680 | -0.2281 | No | ||
| 3 | MRPS12 | 5341 | 0.665 | -0.2079 | No | ||
| 4 | MRPL23 | 7324 | 0.237 | -0.3062 | No | ||
| 5 | MRPS24 | 8264 | 0.062 | -0.3545 | No | ||
| 6 | MRPL52 | 9759 | -0.257 | -0.4258 | No | ||
| 7 | MRPL51 | 9782 | -0.262 | -0.4178 | No | ||
| 8 | MRPS18C | 13316 | -0.990 | -0.5732 | Yes | ||
| 9 | MRPS36 | 13449 | -1.019 | -0.5446 | Yes | ||
| 10 | MRPS16 | 14675 | -1.308 | -0.5647 | Yes | ||
| 11 | MRPS28 | 14969 | -1.384 | -0.5321 | Yes | ||
| 12 | MRPL12 | 15076 | -1.406 | -0.4886 | Yes | ||
| 13 | MRPS18A | 15546 | -1.546 | -0.4598 | Yes | ||
| 14 | MRPS21 | 15746 | -1.609 | -0.4142 | Yes | ||
| 15 | MRPL55 | 16377 | -1.825 | -0.3842 | Yes | ||
| 16 | MRPL10 | 16382 | -1.826 | -0.3206 | Yes | ||
| 17 | MRPL40 | 16725 | -1.973 | -0.2700 | Yes | ||
| 18 | MRPS35 | 18262 | -3.290 | -0.2375 | Yes | ||
| 19 | MRPS10 | 18366 | -3.568 | -0.1182 | Yes | ||
| 20 | MRPS11 | 18437 | -3.763 | 0.0096 | Yes |