Profile of the Running ES Score & Positions of GeneSet Members on the Rank Ordered List
| Dataset | set04_transDMpreB_versus_DMpreB |
| Phenotype | NoPhenotypeAvailable |
| Upregulated in class | na_neg |
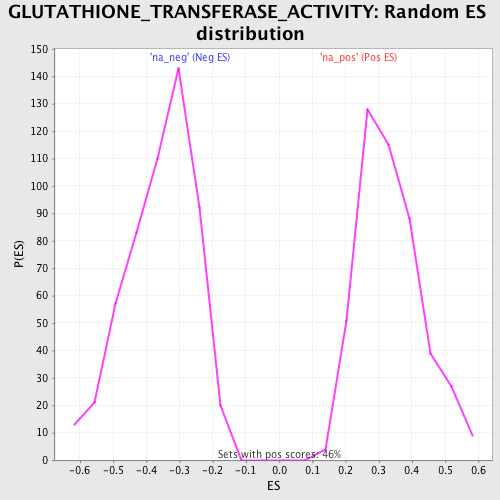
| GeneSet | GLUTATHIONE_TRANSFERASE_ACTIVITY |
| Enrichment Score (ES) | -0.6868498 |
| Normalized Enrichment Score (NES) | -1.9248475 |
| Nominal p-value | 0.0 |
| FDR q-value | 0.047742598 |
| FWER p-Value | 0.306 |
| PROBE | GENE SYMBOL | GENE_TITLE | RANK IN GENE LIST | RANK METRIC SCORE | RUNNING ES | CORE ENRICHMENT | |
|---|---|---|---|---|---|---|---|
| 1 | LTC4S | 5148 | 0.712 | -0.2498 | No | ||
| 2 | GSTA3 | 8883 | -0.066 | -0.4480 | No | ||
| 3 | GSTA2 | 11298 | -0.574 | -0.5560 | No | ||
| 4 | MGST2 | 12498 | -0.811 | -0.5898 | No | ||
| 5 | GSTZ1 | 12956 | -0.910 | -0.5799 | No | ||
| 6 | GSTM5 | 14946 | -1.375 | -0.6348 | Yes | ||
| 7 | GSTM2 | 15191 | -1.436 | -0.5936 | Yes | ||
| 8 | GSTM3 | 16009 | -1.700 | -0.5732 | Yes | ||
| 9 | GSTT1 | 16376 | -1.825 | -0.5237 | Yes | ||
| 10 | MGST1 | 17043 | -2.129 | -0.4790 | Yes | ||
| 11 | GSTA4 | 17405 | -2.369 | -0.4087 | Yes | ||
| 12 | GSTT2 | 17561 | -2.464 | -0.3238 | Yes | ||
| 13 | GSTM4 | 17600 | -2.507 | -0.2309 | Yes | ||
| 14 | MGST3 | 18430 | -3.741 | -0.1339 | Yes | ||
| 15 | GSTM1 | 18442 | -3.800 | 0.0094 | Yes |