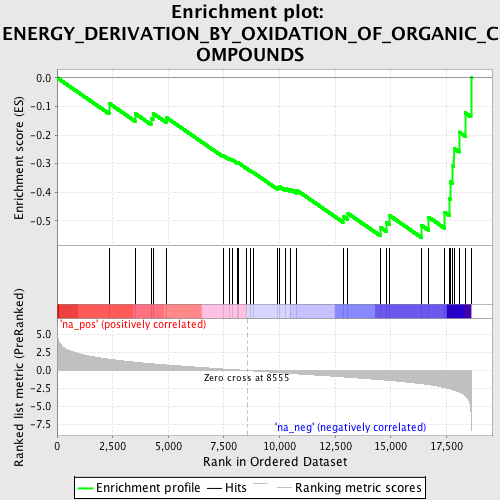
Profile of the Running ES Score & Positions of GeneSet Members on the Rank Ordered List
| Dataset | set04_transDMpreB_versus_DMpreB |
| Phenotype | NoPhenotypeAvailable |
| Upregulated in class | na_neg |
| GeneSet | ENERGY_DERIVATION_BY_OXIDATION_OF_ORGANIC_COMPOUNDS |
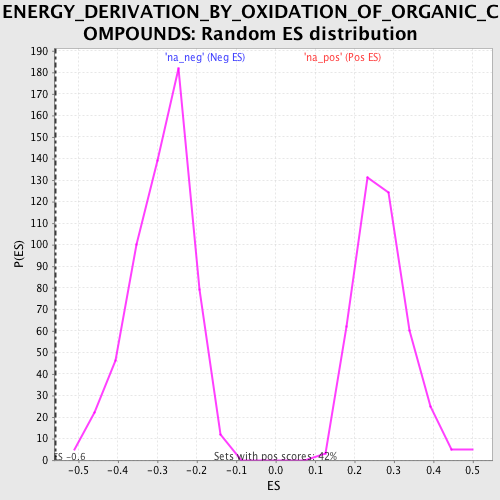
| Enrichment Score (ES) | -0.55762154 |
| Normalized Enrichment Score (NES) | -1.9178715 |
| Nominal p-value | 0.0 |
| FDR q-value | 0.044780556 |
| FWER p-Value | 0.324 |
| PROBE | GENE SYMBOL | GENE_TITLE | RANK IN GENE LIST | RANK METRIC SCORE | RUNNING ES | CORE ENRICHMENT | |
|---|---|---|---|---|---|---|---|
| 1 | LEPR | 2338 | 1.568 | -0.0891 | No | ||
| 2 | CRAT | 3506 | 1.157 | -0.1248 | No | ||
| 3 | LEP | 4223 | 0.942 | -0.1413 | No | ||
| 4 | PYGB | 4313 | 0.922 | -0.1245 | No | ||
| 5 | NDUFS1 | 4920 | 0.766 | -0.1392 | No | ||
| 6 | GCK | 7458 | 0.207 | -0.2709 | No | ||
| 7 | SDHA | 7744 | 0.158 | -0.2825 | No | ||
| 8 | GFPT1 | 7884 | 0.130 | -0.2870 | No | ||
| 9 | UQCRB | 8089 | 0.092 | -0.2958 | No | ||
| 10 | ADRB3 | 8149 | 0.082 | -0.2970 | No | ||
| 11 | UQCRC1 | 8522 | 0.006 | -0.3169 | No | ||
| 12 | GYS2 | 8687 | -0.029 | -0.3250 | No | ||
| 13 | SDHD | 8824 | -0.054 | -0.3311 | No | ||
| 14 | GSK3B | 9910 | -0.287 | -0.3828 | No | ||
| 15 | CYCS | 9987 | -0.305 | -0.3797 | No | ||
| 16 | PPARGC1A | 10259 | -0.366 | -0.3857 | No | ||
| 17 | PYGM | 10496 | -0.411 | -0.3888 | No | ||
| 18 | ACO2 | 10777 | -0.470 | -0.3929 | No | ||
| 19 | ACADVL | 12852 | -0.890 | -0.4837 | No | ||
| 20 | EPM2A | 13070 | -0.935 | -0.4734 | No | ||
| 21 | GFPT2 | 14530 | -1.276 | -0.5221 | Yes | ||
| 22 | TREH | 14797 | -1.338 | -0.5051 | Yes | ||
| 23 | UQCRH | 14927 | -1.368 | -0.4800 | Yes | ||
| 24 | GAA | 16370 | -1.823 | -0.5150 | Yes | ||
| 25 | SDHC | 16695 | -1.962 | -0.4865 | Yes | ||
| 26 | PDHB | 17412 | -2.373 | -0.4695 | Yes | ||
| 27 | NDUFS4 | 17625 | -2.531 | -0.4217 | Yes | ||
| 28 | BCS1L | 17664 | -2.564 | -0.3637 | Yes | ||
| 29 | NNT | 17791 | -2.673 | -0.3079 | Yes | ||
| 30 | SLC25A14 | 17839 | -2.716 | -0.2469 | Yes | ||
| 31 | SURF1 | 18068 | -2.986 | -0.1893 | Yes | ||
| 32 | UQCRC2 | 18342 | -3.482 | -0.1225 | Yes | ||
| 33 | SDHB | 18604 | -5.865 | 0.0006 | Yes |