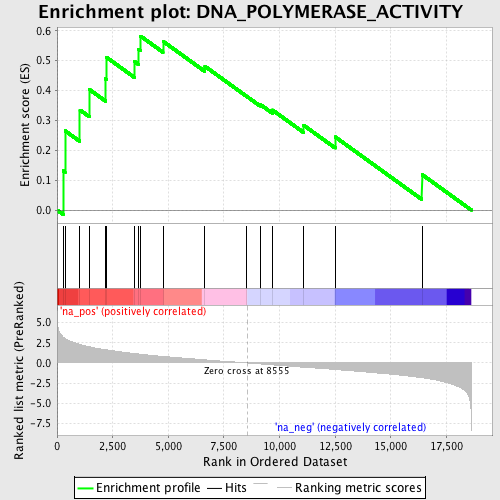
Profile of the Running ES Score & Positions of GeneSet Members on the Rank Ordered List
| Dataset | set04_transDMpreB_versus_DMpreB |
| Phenotype | NoPhenotypeAvailable |
| Upregulated in class | na_pos |
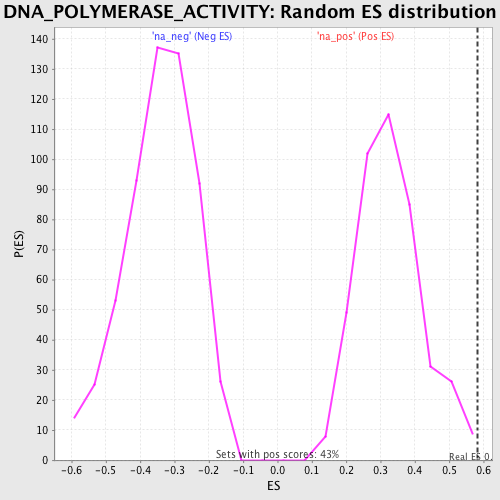
| GeneSet | DNA_POLYMERASE_ACTIVITY |
| Enrichment Score (ES) | 0.58234316 |
| Normalized Enrichment Score (NES) | 1.7751617 |
| Nominal p-value | 0.004705882 |
| FDR q-value | 0.9826727 |
| FWER p-Value | 0.918 |
| PROBE | GENE SYMBOL | GENE_TITLE | RANK IN GENE LIST | RANK METRIC SCORE | RUNNING ES | CORE ENRICHMENT | |
|---|---|---|---|---|---|---|---|
| 1 | POLQ | 274 | 3.198 | 0.1317 | Yes | ||
| 2 | REV3L | 361 | 3.017 | 0.2653 | Yes | ||
| 3 | POLI | 1027 | 2.303 | 0.3350 | Yes | ||
| 4 | POLD1 | 1457 | 1.994 | 0.4033 | Yes | ||
| 5 | POLG | 2180 | 1.637 | 0.4394 | Yes | ||
| 6 | POLE | 2224 | 1.618 | 0.5112 | Yes | ||
| 7 | POLD4 | 3481 | 1.165 | 0.4970 | Yes | ||
| 8 | POLE2 | 3667 | 1.103 | 0.5376 | Yes | ||
| 9 | PTGES3 | 3752 | 1.076 | 0.5823 | Yes | ||
| 10 | POLG2 | 4761 | 0.805 | 0.5650 | No | ||
| 11 | TERT | 6643 | 0.381 | 0.4814 | No | ||
| 12 | POLE3 | 8510 | 0.007 | 0.3814 | No | ||
| 13 | POLA1 | 9128 | -0.120 | 0.3537 | No | ||
| 14 | TEP1 | 9677 | -0.237 | 0.3351 | No | ||
| 15 | POLE4 | 11069 | -0.531 | 0.2846 | No | ||
| 16 | POLH | 12499 | -0.811 | 0.2449 | No | ||
| 17 | POLB | 16401 | -1.832 | 0.1191 | No |