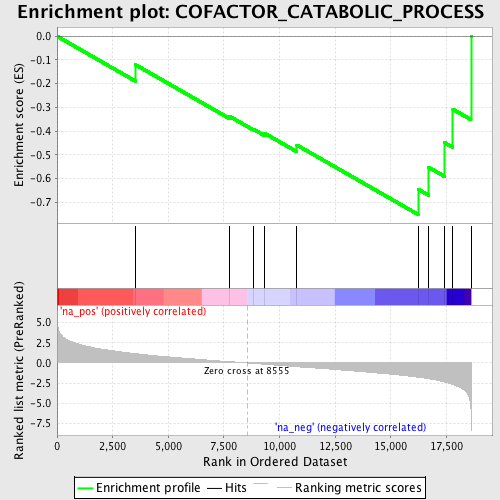
Profile of the Running ES Score & Positions of GeneSet Members on the Rank Ordered List
| Dataset | set04_transDMpreB_versus_DMpreB |
| Phenotype | NoPhenotypeAvailable |
| Upregulated in class | na_neg |
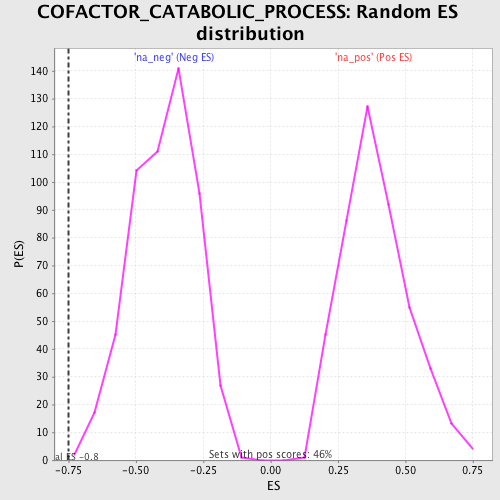
| GeneSet | COFACTOR_CATABOLIC_PROCESS |
| Enrichment Score (ES) | -0.7516134 |
| Normalized Enrichment Score (NES) | -1.9033619 |
| Nominal p-value | 0.0018382353 |
| FDR q-value | 0.046048567 |
| FWER p-Value | 0.369 |
| PROBE | GENE SYMBOL | GENE_TITLE | RANK IN GENE LIST | RANK METRIC SCORE | RUNNING ES | CORE ENRICHMENT | |
|---|---|---|---|---|---|---|---|
| 1 | ALDH1L1 | 3516 | 1.153 | -0.1197 | No | ||
| 2 | SDHA | 7744 | 0.158 | -0.3373 | No | ||
| 3 | SDHD | 8824 | -0.054 | -0.3921 | No | ||
| 4 | UGT1A1 | 9319 | -0.163 | -0.4088 | No | ||
| 5 | ACO2 | 10777 | -0.470 | -0.4589 | No | ||
| 6 | BLVRA | 16225 | -1.773 | -0.6451 | Yes | ||
| 7 | SDHC | 16695 | -1.962 | -0.5524 | Yes | ||
| 8 | PDHB | 17412 | -2.373 | -0.4483 | Yes | ||
| 9 | NNT | 17791 | -2.673 | -0.3081 | Yes | ||
| 10 | SDHB | 18604 | -5.865 | 0.0006 | Yes |