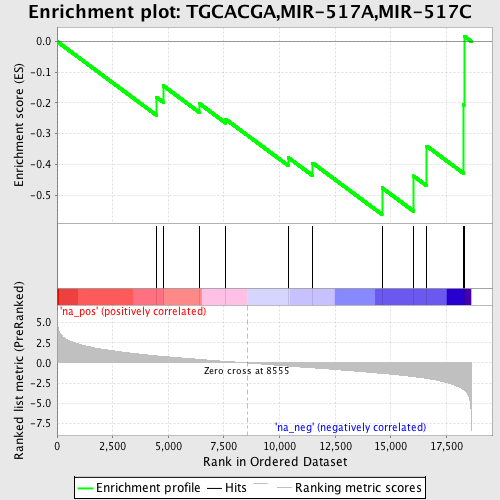
Profile of the Running ES Score & Positions of GeneSet Members on the Rank Ordered List
| Dataset | set04_transDMpreB_versus_DMpreB |
| Phenotype | NoPhenotypeAvailable |
| Upregulated in class | na_neg |
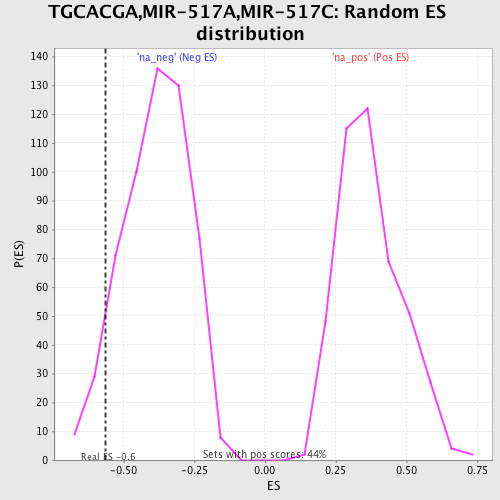
| GeneSet | TGCACGA,MIR-517A,MIR-517C |
| Enrichment Score (ES) | -0.5628176 |
| Normalized Enrichment Score (NES) | -1.4539343 |
| Nominal p-value | 0.06964286 |
| FDR q-value | 0.5704309 |
| FWER p-Value | 1.0 |
| PROBE | GENE SYMBOL | GENE_TITLE | RANK IN GENE LIST | RANK METRIC SCORE | RUNNING ES | CORE ENRICHMENT | |
|---|---|---|---|---|---|---|---|
| 1 | PTK2B | 4470 | 0.877 | -0.1813 | No | ||
| 2 | HNRPU | 4777 | 0.801 | -0.1439 | No | ||
| 3 | SFRS1 | 6416 | 0.432 | -0.2030 | No | ||
| 4 | DBN1 | 7580 | 0.186 | -0.2529 | No | ||
| 5 | BSN | 10391 | -0.393 | -0.3776 | No | ||
| 6 | CDKN2A | 11488 | -0.612 | -0.3953 | No | ||
| 7 | CBLN2 | 14605 | -1.292 | -0.4760 | Yes | ||
| 8 | AMMECR1 | 16017 | -1.703 | -0.4375 | Yes | ||
| 9 | NPAS4 | 16617 | -1.926 | -0.3403 | Yes | ||
| 10 | PHF13 | 18280 | -3.324 | -0.2064 | Yes | ||
| 11 | ACACA | 18291 | -3.340 | 0.0175 | Yes |