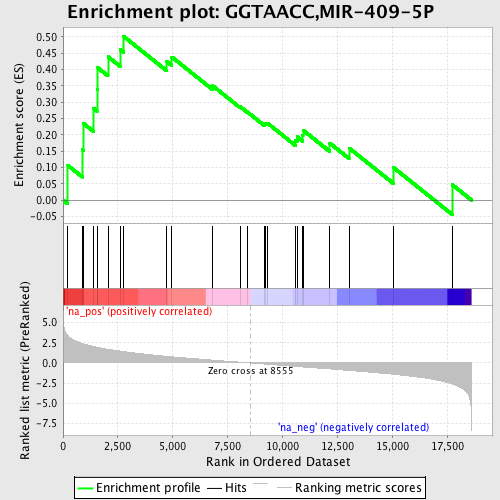
Profile of the Running ES Score & Positions of GeneSet Members on the Rank Ordered List
| Dataset | set04_transDMpreB_versus_DMpreB |
| Phenotype | NoPhenotypeAvailable |
| Upregulated in class | na_pos |
| GeneSet | GGTAACC,MIR-409-5P |
| Enrichment Score (ES) | 0.5025921 |
| Normalized Enrichment Score (NES) | 1.7242981 |
| Nominal p-value | 0.008064516 |
| FDR q-value | 0.070550084 |
| FWER p-Value | 0.353 |
| PROBE | GENE SYMBOL | GENE_TITLE | RANK IN GENE LIST | RANK METRIC SCORE | RUNNING ES | CORE ENRICHMENT | |
|---|---|---|---|---|---|---|---|
| 1 | KIF1B | 217 | 3.381 | 0.1063 | Yes | ||
| 2 | CAMK2G | 879 | 2.414 | 0.1550 | Yes | ||
| 3 | MACF1 | 927 | 2.369 | 0.2351 | Yes | ||
| 4 | ZDHHC9 | 1385 | 2.028 | 0.2813 | Yes | ||
| 5 | BCL9L | 1547 | 1.941 | 0.3404 | Yes | ||
| 6 | MKRN1 | 1584 | 1.919 | 0.4054 | Yes | ||
| 7 | DYRK1A | 2046 | 1.693 | 0.4397 | Yes | ||
| 8 | USP7 | 2599 | 1.466 | 0.4611 | Yes | ||
| 9 | GNG12 | 2745 | 1.412 | 0.5026 | Yes | ||
| 10 | ZIC3 | 4729 | 0.813 | 0.4243 | No | ||
| 11 | ARID4B | 4955 | 0.756 | 0.4386 | No | ||
| 12 | KLF12 | 6826 | 0.342 | 0.3500 | No | ||
| 13 | ACVR2A | 8074 | 0.095 | 0.2862 | No | ||
| 14 | DDX39 | 8395 | 0.035 | 0.2702 | No | ||
| 15 | STAG2 | 9164 | -0.127 | 0.2333 | No | ||
| 16 | EIF2C1 | 9211 | -0.138 | 0.2357 | No | ||
| 17 | ZIC1 | 9310 | -0.161 | 0.2360 | No | ||
| 18 | PURG | 10599 | -0.433 | 0.1819 | No | ||
| 19 | ADAM10 | 10666 | -0.446 | 0.1939 | No | ||
| 20 | APLP2 | 10912 | -0.497 | 0.1980 | No | ||
| 21 | UBE2L3 | 10935 | -0.503 | 0.2144 | No | ||
| 22 | GPM6A | 12149 | -0.734 | 0.1748 | No | ||
| 23 | TRIM9 | 13033 | -0.929 | 0.1597 | No | ||
| 24 | SFRS2 | 15068 | -1.403 | 0.0992 | No | ||
| 25 | TRPS1 | 17732 | -2.624 | 0.0475 | No |
