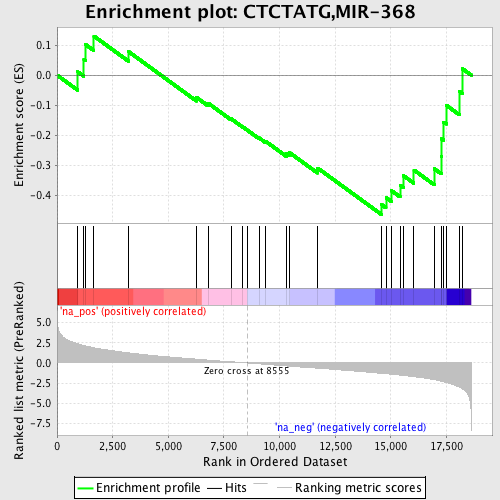
Profile of the Running ES Score & Positions of GeneSet Members on the Rank Ordered List
| Dataset | set04_transDMpreB_versus_DMpreB |
| Phenotype | NoPhenotypeAvailable |
| Upregulated in class | na_neg |
| GeneSet | CTCTATG,MIR-368 |
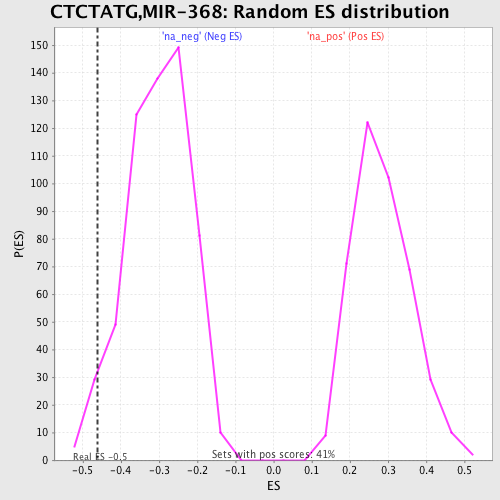
| Enrichment Score (ES) | -0.46275878 |
| Normalized Enrichment Score (NES) | -1.5312383 |
| Nominal p-value | 0.03583618 |
| FDR q-value | 1.0 |
| FWER p-Value | 0.98 |
| PROBE | GENE SYMBOL | GENE_TITLE | RANK IN GENE LIST | RANK METRIC SCORE | RUNNING ES | CORE ENRICHMENT | |
|---|---|---|---|---|---|---|---|
| 1 | GRB2 | 924 | 2.371 | 0.0113 | No | ||
| 2 | MEF2C | 1205 | 2.154 | 0.0516 | No | ||
| 3 | VPS54 | 1277 | 2.100 | 0.1017 | No | ||
| 4 | DACH1 | 1656 | 1.881 | 0.1297 | No | ||
| 5 | CSTF3 | 3219 | 1.249 | 0.0778 | No | ||
| 6 | CABLES1 | 6265 | 0.468 | -0.0740 | No | ||
| 7 | EYA4 | 6784 | 0.351 | -0.0928 | No | ||
| 8 | MYLK | 7818 | 0.144 | -0.1447 | No | ||
| 9 | SEPT7 | 8341 | 0.046 | -0.1716 | No | ||
| 10 | SATB2 | 8555 | -0.000 | -0.1830 | No | ||
| 11 | TM2D1 | 9081 | -0.109 | -0.2085 | No | ||
| 12 | DLX1 | 9384 | -0.174 | -0.2203 | No | ||
| 13 | ZDHHC1 | 10301 | -0.375 | -0.2599 | No | ||
| 14 | MMP19 | 10432 | -0.401 | -0.2566 | No | ||
| 15 | PAX2 | 11707 | -0.651 | -0.3084 | No | ||
| 16 | BDNF | 14578 | -1.287 | -0.4297 | Yes | ||
| 17 | FBXL3 | 14784 | -1.333 | -0.4064 | Yes | ||
| 18 | RGS4 | 15035 | -1.396 | -0.3840 | Yes | ||
| 19 | NFIB | 15419 | -1.508 | -0.3658 | Yes | ||
| 20 | CAPN3 | 15568 | -1.553 | -0.3339 | Yes | ||
| 21 | RNF11 | 16040 | -1.712 | -0.3152 | Yes | ||
| 22 | SET | 16952 | -2.082 | -0.3107 | Yes | ||
| 23 | PTGES2 | 17271 | -2.273 | -0.2694 | Yes | ||
| 24 | CACNA1G | 17286 | -2.280 | -0.2115 | Yes | ||
| 25 | UTS2 | 17374 | -2.346 | -0.1559 | Yes | ||
| 26 | CNIH | 17496 | -2.420 | -0.1002 | Yes | ||
| 27 | FEM1C | 18089 | -3.019 | -0.0544 | Yes | ||
| 28 | SFRS3 | 18223 | -3.218 | 0.0211 | Yes |