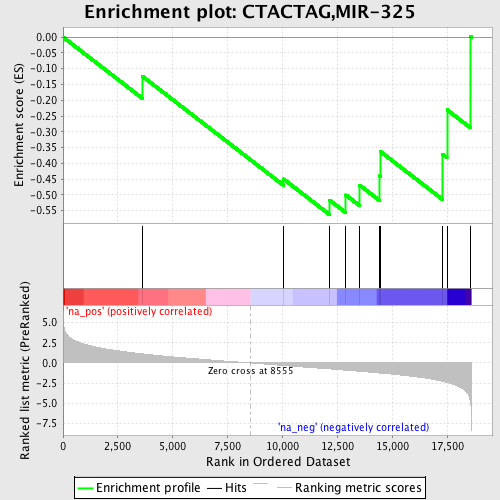
Profile of the Running ES Score & Positions of GeneSet Members on the Rank Ordered List
| Dataset | set04_transDMpreB_versus_DMpreB |
| Phenotype | NoPhenotypeAvailable |
| Upregulated in class | na_neg |
| GeneSet | CTACTAG,MIR-325 |
| Enrichment Score (ES) | -0.56204075 |
| Normalized Enrichment Score (NES) | -1.4046471 |
| Nominal p-value | 0.1005386 |
| FDR q-value | 0.48195446 |
| FWER p-Value | 1.0 |
| PROBE | GENE SYMBOL | GENE_TITLE | RANK IN GENE LIST | RANK METRIC SCORE | RUNNING ES | CORE ENRICHMENT | |
|---|---|---|---|---|---|---|---|
| 1 | CUGBP1 | 3616 | 1.119 | -0.1242 | No | ||
| 2 | GLRA2 | 10041 | -0.318 | -0.4495 | No | ||
| 3 | CRK | 12136 | -0.732 | -0.5161 | Yes | ||
| 4 | CSNK1A1 | 12887 | -0.897 | -0.5002 | Yes | ||
| 5 | BAAT | 13520 | -1.034 | -0.4694 | Yes | ||
| 6 | ARL5B | 14435 | -1.255 | -0.4399 | Yes | ||
| 7 | NEXN | 14450 | -1.257 | -0.3618 | Yes | ||
| 8 | ARRDC3 | 17301 | -2.290 | -0.3714 | Yes | ||
| 9 | ATP1B1 | 17498 | -2.421 | -0.2302 | Yes | ||
| 10 | DIRC2 | 18557 | -4.630 | 0.0032 | Yes |
