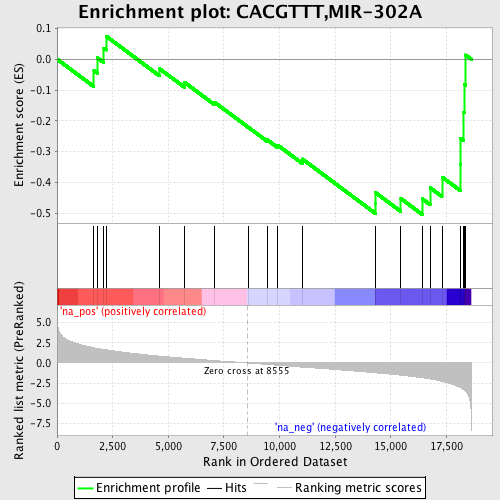
Profile of the Running ES Score & Positions of GeneSet Members on the Rank Ordered List
| Dataset | set04_transDMpreB_versus_DMpreB |
| Phenotype | NoPhenotypeAvailable |
| Upregulated in class | na_neg |
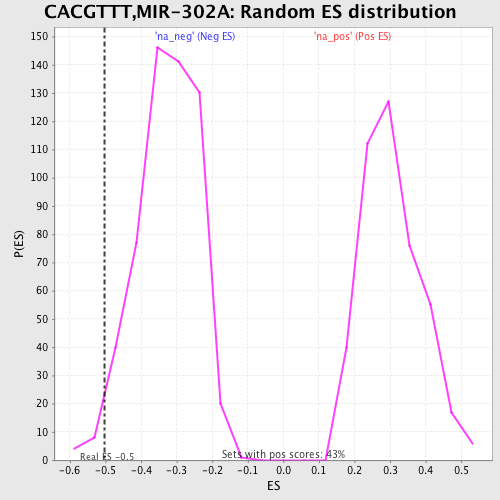
| GeneSet | CACGTTT,MIR-302A |
| Enrichment Score (ES) | -0.5036563 |
| Normalized Enrichment Score (NES) | -1.5494124 |
| Nominal p-value | 0.019400353 |
| FDR q-value | 1.0 |
| FWER p-Value | 0.963 |
| PROBE | GENE SYMBOL | GENE_TITLE | RANK IN GENE LIST | RANK METRIC SCORE | RUNNING ES | CORE ENRICHMENT | |
|---|---|---|---|---|---|---|---|
| 1 | DACH1 | 1656 | 1.881 | -0.0370 | No | ||
| 2 | ZCCHC11 | 1812 | 1.802 | 0.0045 | No | ||
| 3 | PUM1 | 2103 | 1.671 | 0.0351 | No | ||
| 4 | PTPN9 | 2201 | 1.629 | 0.0749 | No | ||
| 5 | DOC2A | 4594 | 0.847 | -0.0303 | No | ||
| 6 | EYA2 | 5733 | 0.587 | -0.0752 | No | ||
| 7 | OTX2 | 7078 | 0.286 | -0.1396 | No | ||
| 8 | MORF4L1 | 8599 | -0.012 | -0.2210 | No | ||
| 9 | PURA | 9436 | -0.185 | -0.2609 | No | ||
| 10 | GSK3B | 9910 | -0.287 | -0.2784 | No | ||
| 11 | UCHL5 | 11022 | -0.523 | -0.3237 | No | ||
| 12 | PRPF4B | 14315 | -1.224 | -0.4669 | Yes | ||
| 13 | BAT5 | 14318 | -1.224 | -0.4331 | Yes | ||
| 14 | FUSIP1 | 15454 | -1.519 | -0.4521 | Yes | ||
| 15 | RAP2C | 16413 | -1.837 | -0.4529 | Yes | ||
| 16 | LRRC8A | 16766 | -1.988 | -0.4168 | Yes | ||
| 17 | ARRDC3 | 17301 | -2.290 | -0.3822 | Yes | ||
| 18 | CNNM3 | 18133 | -3.073 | -0.3419 | Yes | ||
| 19 | SSBP2 | 18140 | -3.084 | -0.2569 | Yes | ||
| 20 | CUL2 | 18261 | -3.287 | -0.1725 | Yes | ||
| 21 | DPYSL5 | 18298 | -3.368 | -0.0813 | Yes | ||
| 22 | TAF5 | 18361 | -3.557 | 0.0137 | Yes |