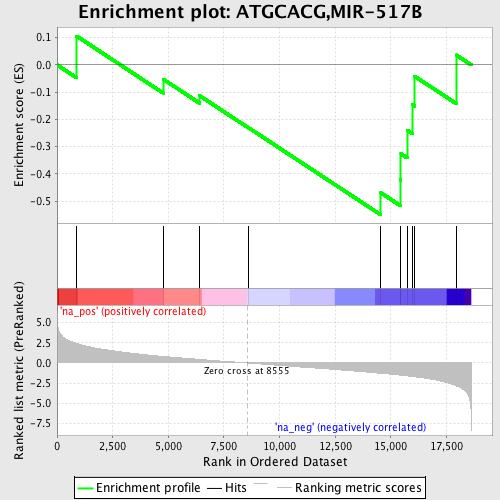
Profile of the Running ES Score & Positions of GeneSet Members on the Rank Ordered List
| Dataset | set04_transDMpreB_versus_DMpreB |
| Phenotype | NoPhenotypeAvailable |
| Upregulated in class | na_neg |
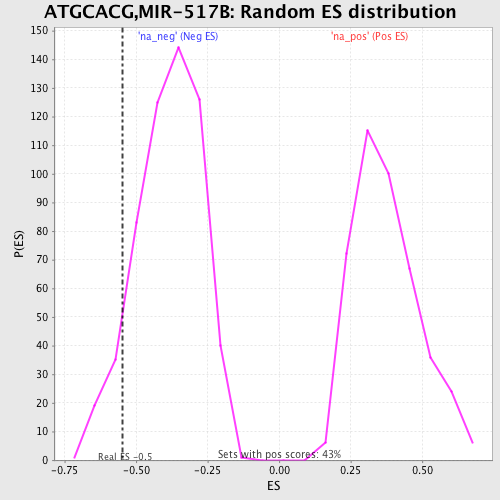
| GeneSet | ATGCACG,MIR-517B |
| Enrichment Score (ES) | -0.5486512 |
| Normalized Enrichment Score (NES) | -1.4298108 |
| Nominal p-value | 0.06968641 |
| FDR q-value | 0.56951964 |
| FWER p-Value | 1.0 |
| PROBE | GENE SYMBOL | GENE_TITLE | RANK IN GENE LIST | RANK METRIC SCORE | RUNNING ES | CORE ENRICHMENT | |
|---|---|---|---|---|---|---|---|
| 1 | CAMK2G | 879 | 2.414 | 0.1056 | No | ||
| 2 | LASS1 | 4765 | 0.804 | -0.0523 | No | ||
| 3 | SFRS1 | 6416 | 0.432 | -0.1137 | No | ||
| 4 | MORF4L1 | 8599 | -0.012 | -0.2302 | No | ||
| 5 | PRDM8 | 14525 | -1.275 | -0.4679 | Yes | ||
| 6 | NR4A3 | 15420 | -1.508 | -0.4205 | Yes | ||
| 7 | FUSIP1 | 15454 | -1.519 | -0.3261 | Yes | ||
| 8 | TBX15 | 15736 | -1.606 | -0.2395 | Yes | ||
| 9 | CABP7 | 15962 | -1.684 | -0.1450 | Yes | ||
| 10 | MORF4L2 | 16074 | -1.725 | -0.0417 | Yes | ||
| 11 | NRXN1 | 17938 | -2.817 | 0.0364 | Yes |