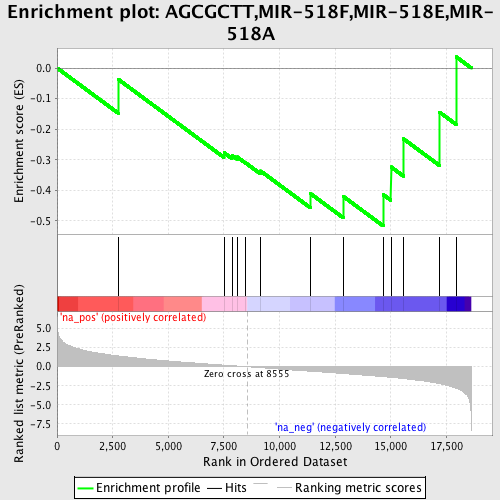
Profile of the Running ES Score & Positions of GeneSet Members on the Rank Ordered List
| Dataset | set04_transDMpreB_versus_DMpreB |
| Phenotype | NoPhenotypeAvailable |
| Upregulated in class | na_neg |
| GeneSet | AGCGCTT,MIR-518F,MIR-518E,MIR-518A |
| Enrichment Score (ES) | -0.51631707 |
| Normalized Enrichment Score (NES) | -1.3931384 |
| Nominal p-value | 0.09913044 |
| FDR q-value | 0.5022539 |
| FWER p-Value | 1.0 |
| PROBE | GENE SYMBOL | GENE_TITLE | RANK IN GENE LIST | RANK METRIC SCORE | RUNNING ES | CORE ENRICHMENT | |
|---|---|---|---|---|---|---|---|
| 1 | SON | 2748 | 1.410 | -0.0370 | No | ||
| 2 | EGR3 | 7502 | 0.200 | -0.2768 | No | ||
| 3 | TAS1R1 | 7863 | 0.135 | -0.2856 | No | ||
| 4 | OTP | 8092 | 0.092 | -0.2907 | No | ||
| 5 | BET1L | 8486 | 0.012 | -0.3109 | No | ||
| 6 | PTPRU | 9146 | -0.124 | -0.3366 | No | ||
| 7 | FCHSD1 | 11392 | -0.592 | -0.4107 | No | ||
| 8 | ZNF385 | 12860 | -0.891 | -0.4196 | Yes | ||
| 9 | RAP1B | 14660 | -1.304 | -0.4140 | Yes | ||
| 10 | CPEB1 | 15007 | -1.391 | -0.3233 | Yes | ||
| 11 | CAPN3 | 15568 | -1.553 | -0.2316 | Yes | ||
| 12 | MCF2L | 17186 | -2.220 | -0.1443 | Yes | ||
| 13 | NRXN1 | 17938 | -2.817 | 0.0364 | Yes |
