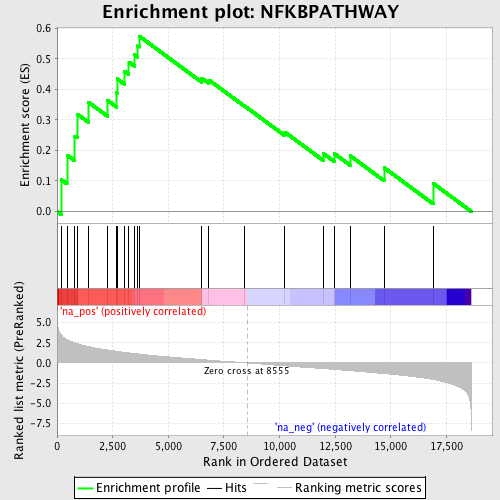
Profile of the Running ES Score & Positions of GeneSet Members on the Rank Ordered List
| Dataset | set04_transDMpreB_versus_DMpreB |
| Phenotype | NoPhenotypeAvailable |
| Upregulated in class | na_pos |
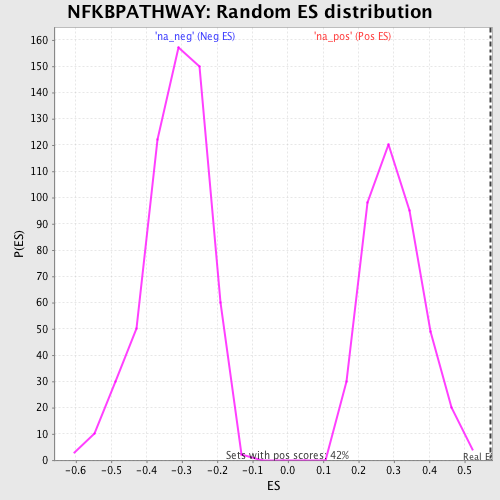
| GeneSet | NFKBPATHWAY |
| Enrichment Score (ES) | 0.5741118 |
| Normalized Enrichment Score (NES) | 1.9083844 |
| Nominal p-value | 0.0 |
| FDR q-value | 0.040795855 |
| FWER p-Value | 0.278 |
| PROBE | GENE SYMBOL | GENE_TITLE | RANK IN GENE LIST | RANK METRIC SCORE | RUNNING ES | CORE ENRICHMENT | |
|---|---|---|---|---|---|---|---|
| 1 | MAP3K14 | 182 | 3.508 | 0.1046 | Yes | ||
| 2 | IRAK1 | 447 | 2.898 | 0.1849 | Yes | ||
| 3 | IKBKB | 798 | 2.484 | 0.2471 | Yes | ||
| 4 | IKBKG | 910 | 2.382 | 0.3188 | Yes | ||
| 5 | MAP3K7 | 1409 | 2.016 | 0.3578 | Yes | ||
| 6 | MAP3K1 | 2266 | 1.599 | 0.3639 | Yes | ||
| 7 | MAP3K7IP1 | 2681 | 1.433 | 0.3883 | Yes | ||
| 8 | TLR4 | 2695 | 1.430 | 0.4343 | Yes | ||
| 9 | TNFRSF1A | 3037 | 1.309 | 0.4586 | Yes | ||
| 10 | IL1R1 | 3230 | 1.244 | 0.4889 | Yes | ||
| 11 | CHUK | 3488 | 1.162 | 0.5129 | Yes | ||
| 12 | RELA | 3628 | 1.116 | 0.5418 | Yes | ||
| 13 | NFKBIA | 3692 | 1.094 | 0.5741 | Yes | ||
| 14 | TNF | 6499 | 0.413 | 0.4367 | No | ||
| 15 | RIPK1 | 6825 | 0.342 | 0.4304 | No | ||
| 16 | NFKB1 | 8403 | 0.033 | 0.3466 | No | ||
| 17 | TNFAIP3 | 10242 | -0.362 | 0.2596 | No | ||
| 18 | TNFRSF1B | 11967 | -0.701 | 0.1897 | No | ||
| 19 | IL1A | 12481 | -0.806 | 0.1884 | No | ||
| 20 | MYD88 | 13171 | -0.957 | 0.1826 | No | ||
| 21 | FADD | 14702 | -1.315 | 0.1432 | No | ||
| 22 | TRAF6 | 16909 | -2.061 | 0.0918 | No |