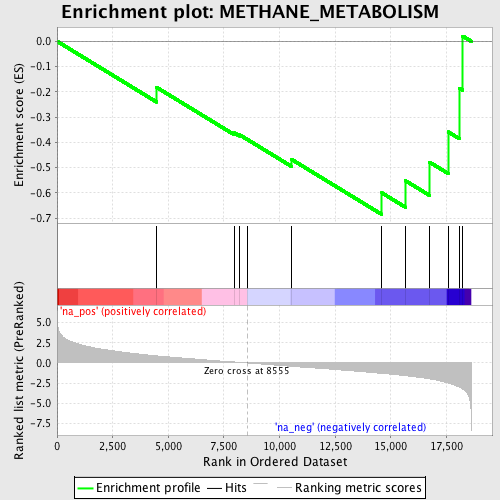
Profile of the Running ES Score & Positions of GeneSet Members on the Rank Ordered List
| Dataset | set04_transDMpreB_versus_DMpreB |
| Phenotype | NoPhenotypeAvailable |
| Upregulated in class | na_neg |
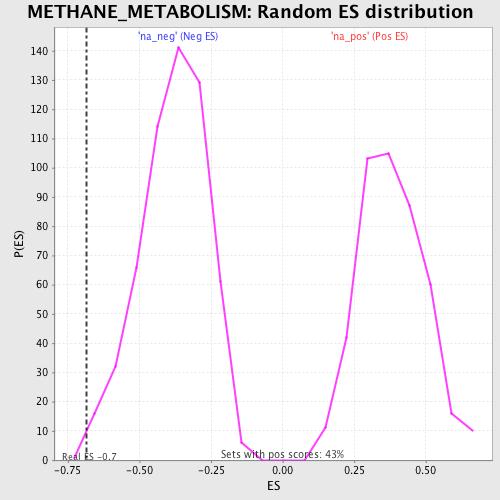
| GeneSet | METHANE_METABOLISM |
| Enrichment Score (ES) | -0.68527246 |
| Normalized Enrichment Score (NES) | -1.7940348 |
| Nominal p-value | 0.0017667845 |
| FDR q-value | 0.057440758 |
| FWER p-Value | 0.567 |
| PROBE | GENE SYMBOL | GENE_TITLE | RANK IN GENE LIST | RANK METRIC SCORE | RUNNING ES | CORE ENRICHMENT | |
|---|---|---|---|---|---|---|---|
| 1 | CAT | 4474 | 0.877 | -0.1823 | No | ||
| 2 | MPO | 7968 | 0.113 | -0.3625 | No | ||
| 3 | LPO | 8200 | 0.074 | -0.3700 | No | ||
| 4 | EPX | 8578 | -0.005 | -0.3899 | No | ||
| 5 | TPO | 10545 | -0.422 | -0.4676 | No | ||
| 6 | PRDX5 | 14596 | -1.290 | -0.5997 | Yes | ||
| 7 | PRDX1 | 15663 | -1.583 | -0.5519 | Yes | ||
| 8 | PRDX6 | 16743 | -1.981 | -0.4784 | Yes | ||
| 9 | SHMT2 | 17580 | -2.484 | -0.3585 | Yes | ||
| 10 | PRDX2 | 18082 | -3.008 | -0.1858 | Yes | ||
| 11 | SHMT1 | 18234 | -3.231 | 0.0205 | Yes |