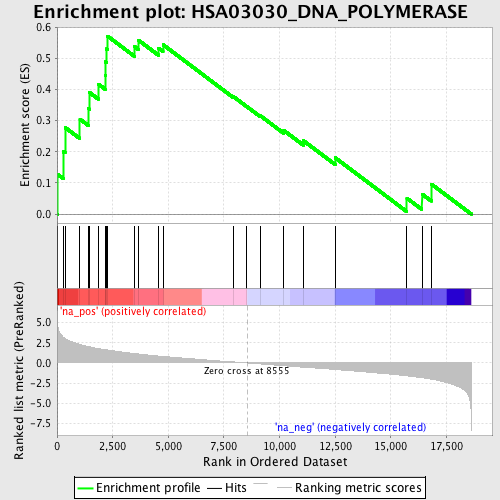
Profile of the Running ES Score & Positions of GeneSet Members on the Rank Ordered List
| Dataset | set04_transDMpreB_versus_DMpreB |
| Phenotype | NoPhenotypeAvailable |
| Upregulated in class | na_pos |
| GeneSet | HSA03030_DNA_POLYMERASE |
| Enrichment Score (ES) | 0.5716893 |
| Normalized Enrichment Score (NES) | 1.9196278 |
| Nominal p-value | 0.0025062656 |
| FDR q-value | 0.042541478 |
| FWER p-Value | 0.245 |
| PROBE | GENE SYMBOL | GENE_TITLE | RANK IN GENE LIST | RANK METRIC SCORE | RUNNING ES | CORE ENRICHMENT | |
|---|---|---|---|---|---|---|---|
| 1 | POLD3 | 22 | 4.753 | 0.1277 | Yes | ||
| 2 | POLQ | 274 | 3.198 | 0.2009 | Yes | ||
| 3 | REV3L | 361 | 3.017 | 0.2781 | Yes | ||
| 4 | POLI | 1027 | 2.303 | 0.3048 | Yes | ||
| 5 | POLA2 | 1411 | 2.014 | 0.3388 | Yes | ||
| 6 | POLD1 | 1457 | 1.994 | 0.3905 | Yes | ||
| 7 | POLS | 1852 | 1.782 | 0.4176 | Yes | ||
| 8 | POLK | 2161 | 1.645 | 0.4457 | Yes | ||
| 9 | POLG | 2180 | 1.637 | 0.4891 | Yes | ||
| 10 | POLE | 2224 | 1.618 | 0.5306 | Yes | ||
| 11 | POLM | 2267 | 1.598 | 0.5717 | Yes | ||
| 12 | POLD4 | 3481 | 1.165 | 0.5380 | No | ||
| 13 | POLE2 | 3667 | 1.103 | 0.5580 | No | ||
| 14 | POLL | 4566 | 0.853 | 0.5328 | No | ||
| 15 | POLG2 | 4761 | 0.805 | 0.5442 | No | ||
| 16 | PRIM1 | 7913 | 0.124 | 0.3781 | No | ||
| 17 | POLE3 | 8510 | 0.007 | 0.3463 | No | ||
| 18 | POLA1 | 9128 | -0.120 | 0.3163 | No | ||
| 19 | REV1 | 10190 | -0.348 | 0.2687 | No | ||
| 20 | POLE4 | 11069 | -0.531 | 0.2359 | No | ||
| 21 | POLH | 12499 | -0.811 | 0.1810 | No | ||
| 22 | POLD2 | 15725 | -1.603 | 0.0510 | No | ||
| 23 | POLB | 16401 | -1.832 | 0.0644 | No | ||
| 24 | RFC5 | 16820 | -2.016 | 0.0966 | No |
