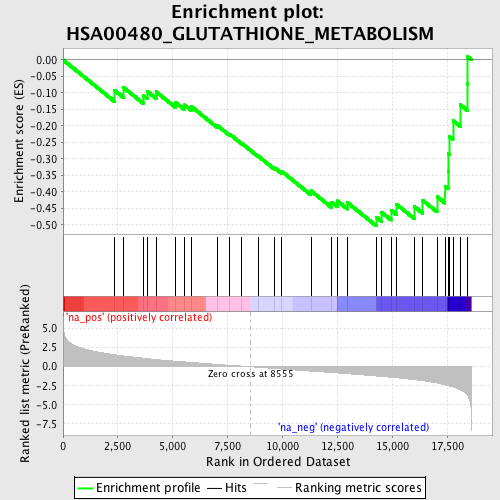
Profile of the Running ES Score & Positions of GeneSet Members on the Rank Ordered List
| Dataset | set04_transDMpreB_versus_DMpreB |
| Phenotype | NoPhenotypeAvailable |
| Upregulated in class | na_neg |
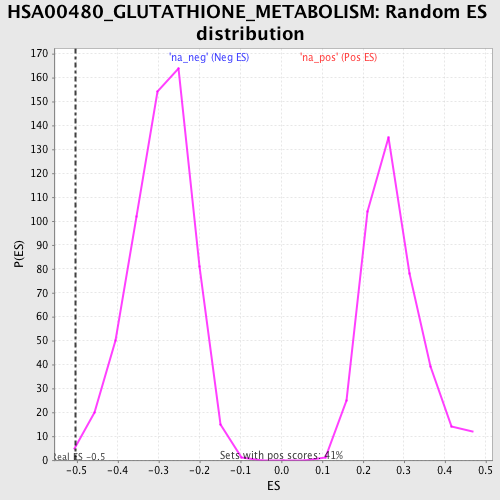
| GeneSet | HSA00480_GLUTATHIONE_METABOLISM |
| Enrichment Score (ES) | -0.5035331 |
| Normalized Enrichment Score (NES) | -1.7199384 |
| Nominal p-value | 0.0050675673 |
| FDR q-value | 0.085212104 |
| FWER p-Value | 0.836 |
| PROBE | GENE SYMBOL | GENE_TITLE | RANK IN GENE LIST | RANK METRIC SCORE | RUNNING ES | CORE ENRICHMENT | |
|---|---|---|---|---|---|---|---|
| 1 | GPX5 | 2348 | 1.565 | -0.0924 | No | ||
| 2 | GCLC | 2758 | 1.406 | -0.0840 | No | ||
| 3 | GPX6 | 3663 | 1.104 | -0.1087 | No | ||
| 4 | GPX2 | 3844 | 1.044 | -0.0958 | No | ||
| 5 | GPX1 | 4238 | 0.938 | -0.0966 | No | ||
| 6 | IDH2 | 5117 | 0.720 | -0.1282 | No | ||
| 7 | OPLAH | 5523 | 0.627 | -0.1364 | No | ||
| 8 | GGT1 | 5848 | 0.558 | -0.1418 | No | ||
| 9 | GSTA1 | 7043 | 0.294 | -0.1996 | No | ||
| 10 | GPX3 | 7597 | 0.184 | -0.2254 | No | ||
| 11 | GCLM | 8150 | 0.082 | -0.2533 | No | ||
| 12 | GSTA3 | 8883 | -0.066 | -0.2913 | No | ||
| 13 | GSR | 9653 | -0.232 | -0.3276 | No | ||
| 14 | ANPEP | 9960 | -0.298 | -0.3376 | No | ||
| 15 | GSTA2 | 11298 | -0.574 | -0.3971 | No | ||
| 16 | IDH1 | 12245 | -0.759 | -0.4316 | No | ||
| 17 | MGST2 | 12498 | -0.811 | -0.4276 | No | ||
| 18 | GSTZ1 | 12956 | -0.910 | -0.4325 | No | ||
| 19 | GSTP1 | 14278 | -1.214 | -0.4772 | Yes | ||
| 20 | GSS | 14522 | -1.274 | -0.4627 | Yes | ||
| 21 | GSTM5 | 14946 | -1.375 | -0.4557 | Yes | ||
| 22 | GSTM2 | 15191 | -1.436 | -0.4377 | Yes | ||
| 23 | GSTM3 | 16009 | -1.700 | -0.4448 | Yes | ||
| 24 | GSTT1 | 16376 | -1.825 | -0.4250 | Yes | ||
| 25 | MGST1 | 17043 | -2.129 | -0.4146 | Yes | ||
| 26 | GSTA4 | 17405 | -2.369 | -0.3827 | Yes | ||
| 27 | GGTL3 | 17550 | -2.455 | -0.3373 | Yes | ||
| 28 | GSTT2 | 17561 | -2.464 | -0.2844 | Yes | ||
| 29 | GSTM4 | 17600 | -2.507 | -0.2322 | Yes | ||
| 30 | GPX7 | 17771 | -2.651 | -0.1839 | Yes | ||
| 31 | GPX4 | 18103 | -3.035 | -0.1359 | Yes | ||
| 32 | MGST3 | 18430 | -3.741 | -0.0724 | Yes | ||
| 33 | GSTM1 | 18442 | -3.800 | 0.0094 | Yes |