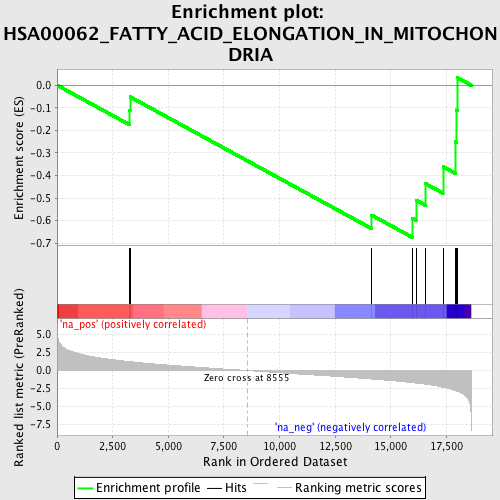
Profile of the Running ES Score & Positions of GeneSet Members on the Rank Ordered List
| Dataset | set04_transDMpreB_versus_DMpreB |
| Phenotype | NoPhenotypeAvailable |
| Upregulated in class | na_neg |
| GeneSet | HSA00062_FATTY_ACID_ELONGATION_IN_MITOCHONDRIA |
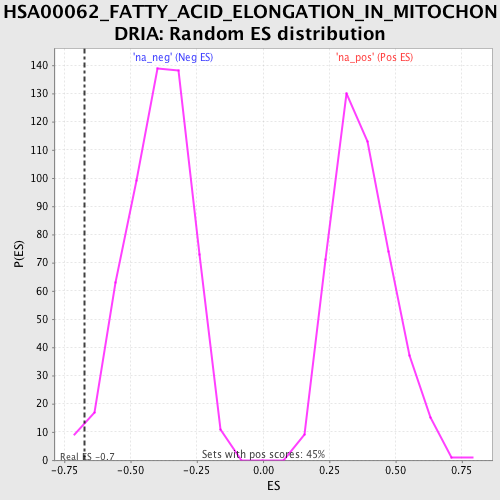
| Enrichment Score (ES) | -0.6741714 |
| Normalized Enrichment Score (NES) | -1.7015401 |
| Nominal p-value | 0.016393442 |
| FDR q-value | 0.08300514 |
| FWER p-Value | 0.885 |

| PROBE | GENE SYMBOL | GENE_TITLE | RANK IN GENE LIST | RANK METRIC SCORE | RUNNING ES | CORE ENRICHMENT | |
|---|---|---|---|---|---|---|---|
| 1 | HADHA | 3240 | 1.241 | -0.1114 | No | ||
| 2 | HSD17B4 | 3280 | 1.227 | -0.0515 | No | ||
| 3 | HADH | 14130 | -1.178 | -0.5751 | No | ||
| 4 | PPT1 | 15975 | -1.689 | -0.5889 | Yes | ||
| 5 | ACAA2 | 16140 | -1.745 | -0.5095 | Yes | ||
| 6 | PPT2 | 16573 | -1.903 | -0.4366 | Yes | ||
| 7 | MECR | 17347 | -2.326 | -0.3606 | Yes | ||
| 8 | HSD17B10 | 17908 | -2.777 | -0.2504 | Yes | ||
| 9 | HADHB | 17943 | -2.825 | -0.1095 | Yes | ||
| 10 | ECHS1 | 17985 | -2.883 | 0.0339 | Yes |
