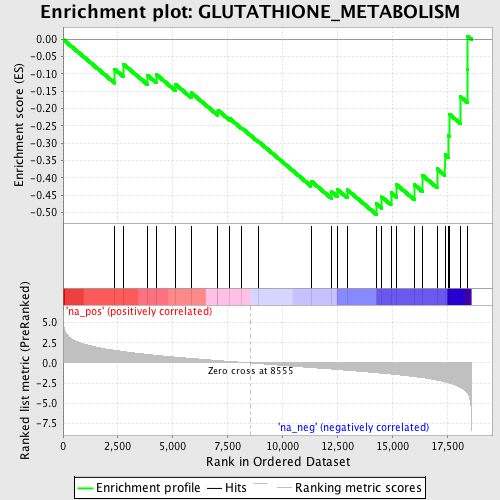
Profile of the Running ES Score & Positions of GeneSet Members on the Rank Ordered List
| Dataset | set04_transDMpreB_versus_DMpreB |
| Phenotype | NoPhenotypeAvailable |
| Upregulated in class | na_neg |
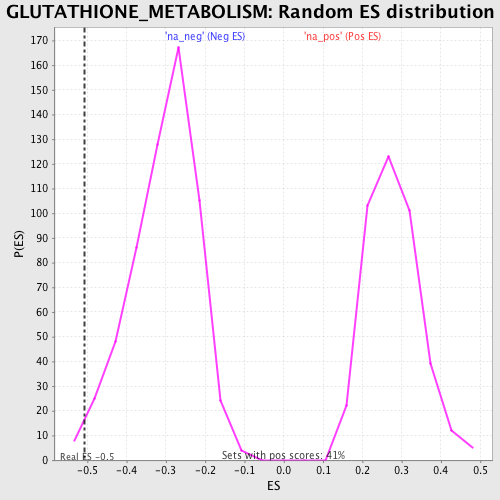
| GeneSet | GLUTATHIONE_METABOLISM |
| Enrichment Score (ES) | -0.5061819 |
| Normalized Enrichment Score (NES) | -1.651927 |
| Nominal p-value | 0.013445378 |
| FDR q-value | 0.10510778 |
| FWER p-Value | 0.968 |
| PROBE | GENE SYMBOL | GENE_TITLE | RANK IN GENE LIST | RANK METRIC SCORE | RUNNING ES | CORE ENRICHMENT | |
|---|---|---|---|---|---|---|---|
| 1 | GPX5 | 2348 | 1.565 | -0.0863 | No | ||
| 2 | GCLC | 2758 | 1.406 | -0.0723 | No | ||
| 3 | GPX2 | 3844 | 1.044 | -0.1039 | No | ||
| 4 | GPX1 | 4238 | 0.938 | -0.1010 | No | ||
| 5 | IDH2 | 5117 | 0.720 | -0.1298 | No | ||
| 6 | GGT1 | 5848 | 0.558 | -0.1548 | No | ||
| 7 | GSTA1 | 7043 | 0.294 | -0.2115 | No | ||
| 8 | PGD | 7058 | 0.289 | -0.2049 | No | ||
| 9 | GPX3 | 7597 | 0.184 | -0.2291 | No | ||
| 10 | GCLM | 8150 | 0.082 | -0.2567 | No | ||
| 11 | GSTA3 | 8883 | -0.066 | -0.2944 | No | ||
| 12 | GSTA2 | 11298 | -0.574 | -0.4095 | No | ||
| 13 | IDH1 | 12245 | -0.759 | -0.4410 | No | ||
| 14 | MGST2 | 12498 | -0.811 | -0.4338 | No | ||
| 15 | GSTZ1 | 12956 | -0.910 | -0.4351 | No | ||
| 16 | GSTP1 | 14278 | -1.214 | -0.4751 | Yes | ||
| 17 | GSS | 14522 | -1.274 | -0.4556 | Yes | ||
| 18 | GSTM5 | 14946 | -1.375 | -0.4431 | Yes | ||
| 19 | GSTM2 | 15191 | -1.436 | -0.4195 | Yes | ||
| 20 | GSTM3 | 16009 | -1.700 | -0.4200 | Yes | ||
| 21 | GSTT1 | 16376 | -1.825 | -0.3929 | Yes | ||
| 22 | MGST1 | 17043 | -2.129 | -0.3743 | Yes | ||
| 23 | GSTA4 | 17405 | -2.369 | -0.3330 | Yes | ||
| 24 | GSTT2 | 17561 | -2.464 | -0.2783 | Yes | ||
| 25 | GSTM4 | 17600 | -2.507 | -0.2162 | Yes | ||
| 26 | GPX4 | 18103 | -3.035 | -0.1655 | Yes | ||
| 27 | MGST3 | 18430 | -3.741 | -0.0873 | Yes | ||
| 28 | GSTM1 | 18442 | -3.800 | 0.0094 | Yes |