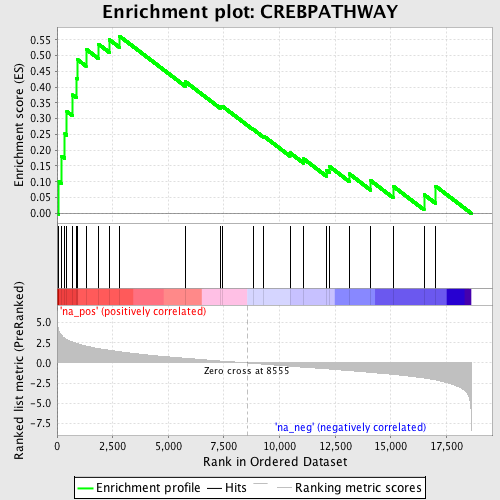
Profile of the Running ES Score & Positions of GeneSet Members on the Rank Ordered List
| Dataset | set04_transDMpreB_versus_DMpreB |
| Phenotype | NoPhenotypeAvailable |
| Upregulated in class | na_pos |
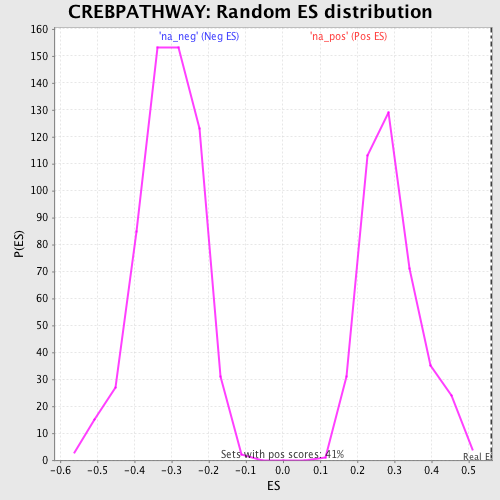
| GeneSet | CREBPATHWAY |
| Enrichment Score (ES) | 0.56142867 |
| Normalized Enrichment Score (NES) | 1.9220496 |
| Nominal p-value | 0.0 |
| FDR q-value | 0.046588022 |
| FWER p-Value | 0.243 |
| PROBE | GENE SYMBOL | GENE_TITLE | RANK IN GENE LIST | RANK METRIC SCORE | RUNNING ES | CORE ENRICHMENT | |
|---|---|---|---|---|---|---|---|
| 1 | PRKCB1 | 67 | 4.060 | 0.1011 | Yes | ||
| 2 | CAMK2A | 208 | 3.401 | 0.1814 | Yes | ||
| 3 | PRKAR2B | 349 | 3.038 | 0.2522 | Yes | ||
| 4 | MAPK14 | 438 | 2.913 | 0.3226 | Yes | ||
| 5 | RPS6KA1 | 701 | 2.582 | 0.3751 | Yes | ||
| 6 | CAMK2G | 879 | 2.414 | 0.4279 | Yes | ||
| 7 | GRB2 | 924 | 2.371 | 0.4867 | Yes | ||
| 8 | MAPK3 | 1303 | 2.079 | 0.5200 | Yes | ||
| 9 | GNAS | 1854 | 1.780 | 0.5363 | Yes | ||
| 10 | CREB1 | 2352 | 1.562 | 0.5499 | Yes | ||
| 11 | PRKACB | 2804 | 1.387 | 0.5614 | Yes | ||
| 12 | SOS1 | 5763 | 0.579 | 0.4173 | No | ||
| 13 | PRKAR2A | 7362 | 0.230 | 0.3373 | No | ||
| 14 | PIK3R1 | 7425 | 0.214 | 0.3394 | No | ||
| 15 | CAMK2B | 8806 | -0.050 | 0.2665 | No | ||
| 16 | AKT1 | 9294 | -0.158 | 0.2444 | No | ||
| 17 | PRKCA | 10469 | -0.407 | 0.1917 | No | ||
| 18 | CAMK2D | 11082 | -0.534 | 0.1726 | No | ||
| 19 | RAC1 | 12108 | -0.727 | 0.1362 | No | ||
| 20 | PRKAR1A | 12238 | -0.757 | 0.1488 | No | ||
| 21 | HRAS | 13137 | -0.949 | 0.1250 | No | ||
| 22 | PIK3CA | 14098 | -1.169 | 0.1035 | No | ||
| 23 | RPS6KA5 | 15107 | -1.413 | 0.0857 | No | ||
| 24 | MAPK1 | 16496 | -1.873 | 0.0594 | No | ||
| 25 | PRKAR1B | 17017 | -2.114 | 0.0860 | No |