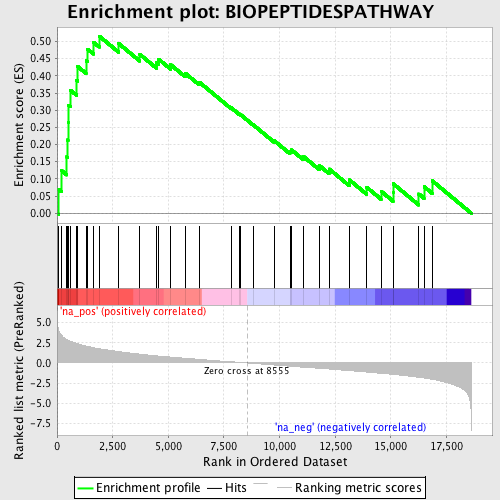
Profile of the Running ES Score & Positions of GeneSet Members on the Rank Ordered List
| Dataset | set04_transDMpreB_versus_DMpreB |
| Phenotype | NoPhenotypeAvailable |
| Upregulated in class | na_pos |
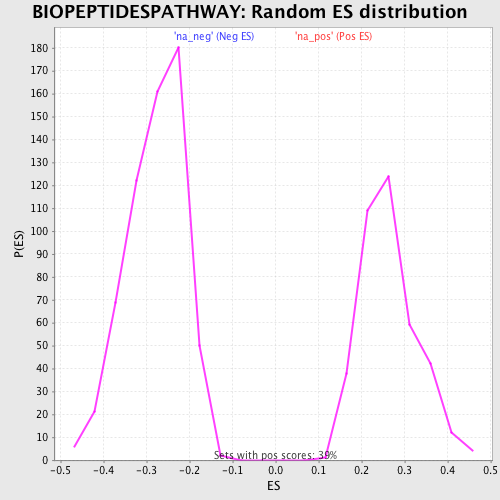
| GeneSet | BIOPEPTIDESPATHWAY |
| Enrichment Score (ES) | 0.5155816 |
| Normalized Enrichment Score (NES) | 1.9532608 |
| Nominal p-value | 0.0 |
| FDR q-value | 0.037445396 |
| FWER p-Value | 0.183 |
| PROBE | GENE SYMBOL | GENE_TITLE | RANK IN GENE LIST | RANK METRIC SCORE | RUNNING ES | CORE ENRICHMENT | |
|---|---|---|---|---|---|---|---|
| 1 | PRKCB1 | 67 | 4.060 | 0.0697 | Yes | ||
| 2 | CAMK2A | 208 | 3.401 | 0.1236 | Yes | ||
| 3 | MAPK14 | 438 | 2.913 | 0.1639 | Yes | ||
| 4 | STAT3 | 479 | 2.857 | 0.2134 | Yes | ||
| 5 | AGTR2 | 493 | 2.835 | 0.2639 | Yes | ||
| 6 | MAP2K1 | 502 | 2.825 | 0.3145 | Yes | ||
| 7 | JAK2 | 591 | 2.705 | 0.3586 | Yes | ||
| 8 | CAMK2G | 879 | 2.414 | 0.3867 | Yes | ||
| 9 | GRB2 | 924 | 2.371 | 0.4272 | Yes | ||
| 10 | MAPK3 | 1303 | 2.079 | 0.4444 | Yes | ||
| 11 | GNA11 | 1368 | 2.038 | 0.4778 | Yes | ||
| 12 | MAP2K2 | 1638 | 1.892 | 0.4975 | Yes | ||
| 13 | CDK5 | 1894 | 1.764 | 0.5156 | Yes | ||
| 14 | RAF1 | 2767 | 1.403 | 0.4940 | No | ||
| 15 | PLCG1 | 3717 | 1.086 | 0.4625 | No | ||
| 16 | PTK2B | 4470 | 0.877 | 0.4379 | No | ||
| 17 | STAT5A | 4560 | 0.854 | 0.4485 | No | ||
| 18 | GNGT1 | 5107 | 0.722 | 0.4322 | No | ||
| 19 | SOS1 | 5763 | 0.579 | 0.4074 | No | ||
| 20 | AGT | 6385 | 0.438 | 0.3819 | No | ||
| 21 | MYLK | 7818 | 0.144 | 0.3074 | No | ||
| 22 | CALM2 | 8186 | 0.076 | 0.2890 | No | ||
| 23 | CALM3 | 8250 | 0.066 | 0.2868 | No | ||
| 24 | CAMK2B | 8806 | -0.050 | 0.2578 | No | ||
| 25 | CALM1 | 9748 | -0.254 | 0.2118 | No | ||
| 26 | PRKCA | 10469 | -0.407 | 0.1804 | No | ||
| 27 | SYT1 | 10535 | -0.420 | 0.1844 | No | ||
| 28 | CAMK2D | 11082 | -0.534 | 0.1647 | No | ||
| 29 | STAT1 | 11783 | -0.667 | 0.1391 | No | ||
| 30 | GNB1 | 12227 | -0.753 | 0.1288 | No | ||
| 31 | HRAS | 13137 | -0.949 | 0.0971 | No | ||
| 32 | FYN | 13920 | -1.129 | 0.0754 | No | ||
| 33 | MAPK8 | 14563 | -1.284 | 0.0640 | No | ||
| 34 | SHC1 | 15101 | -1.412 | 0.0606 | No | ||
| 35 | GNAI1 | 15109 | -1.414 | 0.0858 | No | ||
| 36 | MAPT | 16260 | -1.784 | 0.0561 | No | ||
| 37 | MAPK1 | 16496 | -1.873 | 0.0773 | No | ||
| 38 | F2 | 16859 | -2.037 | 0.0946 | No |