Profile of the Running ES Score & Positions of GeneSet Members on the Rank Ordered List
| Dataset | set04_DMproB_versus_LMproB |
| Phenotype | NoPhenotypeAvailable |
| Upregulated in class | na_neg |
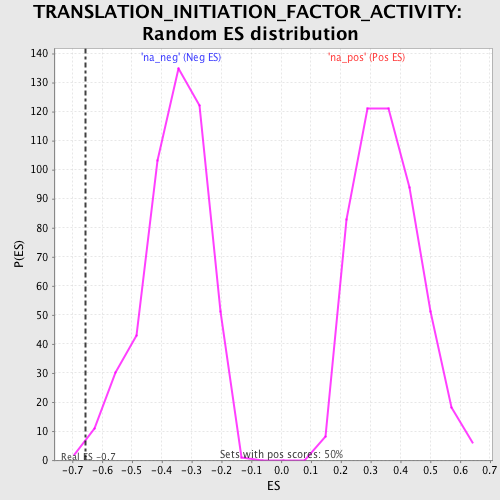
| GeneSet | TRANSLATION_INITIATION_FACTOR_ACTIVITY |
| Enrichment Score (ES) | -0.65717703 |
| Normalized Enrichment Score (NES) | -1.8314053 |
| Nominal p-value | 0.006024096 |
| FDR q-value | 0.077858575 |
| FWER p-Value | 0.755 |
| PROBE | GENE SYMBOL | GENE_TITLE | RANK IN GENE LIST | RANK METRIC SCORE | RUNNING ES | CORE ENRICHMENT | |
|---|---|---|---|---|---|---|---|
| 1 | EIF4G1 | 5685 | 0.531 | -0.2777 | No | ||
| 2 | EIF2C1 | 9019 | -0.019 | -0.4559 | No | ||
| 3 | EIF2S1 | 9479 | -0.086 | -0.4761 | No | ||
| 4 | EIF2B2 | 10126 | -0.185 | -0.5011 | No | ||
| 5 | EIF4H | 11945 | -0.478 | -0.5737 | No | ||
| 6 | EIF2B5 | 12986 | -0.665 | -0.5947 | No | ||
| 7 | EIF2B3 | 13275 | -0.708 | -0.5730 | No | ||
| 8 | COPS5 | 14841 | -1.025 | -0.6033 | Yes | ||
| 9 | EIF2B4 | 14995 | -1.056 | -0.5561 | Yes | ||
| 10 | EIF4E | 15500 | -1.188 | -0.5208 | Yes | ||
| 11 | EIF2B1 | 16282 | -1.421 | -0.4882 | Yes | ||
| 12 | EIF4A2 | 16655 | -1.564 | -0.4261 | Yes | ||
| 13 | EIF4G2 | 16666 | -1.569 | -0.3443 | Yes | ||
| 14 | EIF4B | 17191 | -1.827 | -0.2765 | Yes | ||
| 15 | EIF2S2 | 18093 | -2.674 | -0.1846 | Yes | ||
| 16 | EIF5A | 18481 | -4.050 | 0.0073 | Yes |