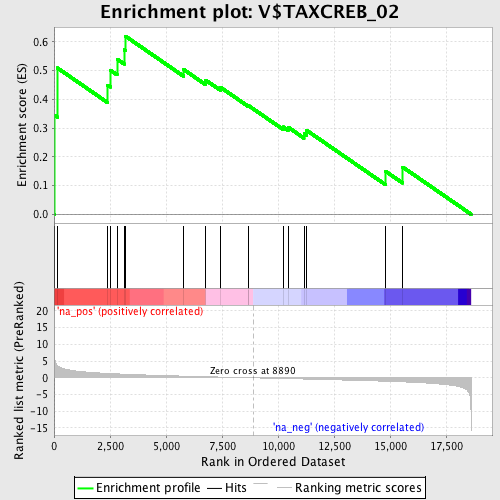
Profile of the Running ES Score & Positions of GeneSet Members on the Rank Ordered List
| Dataset | set04_DMproB_versus_LMproB |
| Phenotype | NoPhenotypeAvailable |
| Upregulated in class | na_pos |
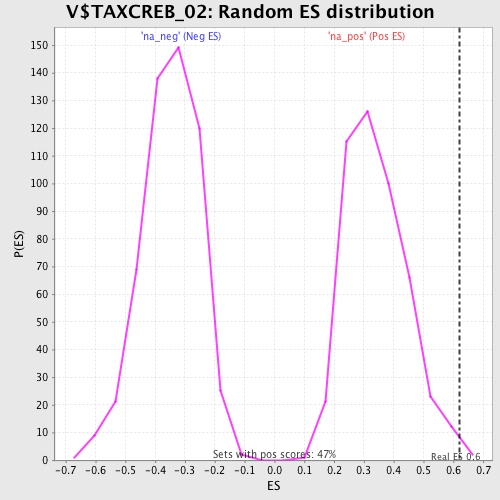
| GeneSet | V$TAXCREB_02 |
| Enrichment Score (ES) | 0.61992437 |
| Normalized Enrichment Score (NES) | 1.8086299 |
| Nominal p-value | 0.006437768 |
| FDR q-value | 0.2026841 |
| FWER p-Value | 0.185 |
| PROBE | GENE SYMBOL | GENE_TITLE | RANK IN GENE LIST | RANK METRIC SCORE | RUNNING ES | CORE ENRICHMENT | |
|---|---|---|---|---|---|---|---|
| 1 | EMP3 | 12 | 7.482 | 0.3449 | Yes | ||
| 2 | BCL11A | 142 | 3.712 | 0.5094 | Yes | ||
| 3 | SSBP3 | 2394 | 1.308 | 0.4487 | Yes | ||
| 4 | SERTAD1 | 2508 | 1.272 | 0.5014 | Yes | ||
| 5 | OTP | 2813 | 1.179 | 0.5395 | Yes | ||
| 6 | EEF1A1 | 3129 | 1.090 | 0.5729 | Yes | ||
| 7 | CAPN6 | 3181 | 1.077 | 0.6199 | Yes | ||
| 8 | JAG1 | 5787 | 0.511 | 0.5034 | No | ||
| 9 | PPP1R11 | 6765 | 0.345 | 0.4668 | No | ||
| 10 | CRLF1 | 7431 | 0.231 | 0.4417 | No | ||
| 11 | ARIH1 | 8662 | 0.038 | 0.3774 | No | ||
| 12 | STX12 | 8699 | 0.033 | 0.3770 | No | ||
| 13 | ADIPOR2 | 10228 | -0.199 | 0.3040 | No | ||
| 14 | NAB2 | 10448 | -0.231 | 0.3029 | No | ||
| 15 | DLK1 | 11156 | -0.352 | 0.2812 | No | ||
| 16 | LIN28 | 11267 | -0.372 | 0.2924 | No | ||
| 17 | S100A10 | 14804 | -1.016 | 0.1493 | No | ||
| 18 | NKX2-3 | 15559 | -1.205 | 0.1644 | No |