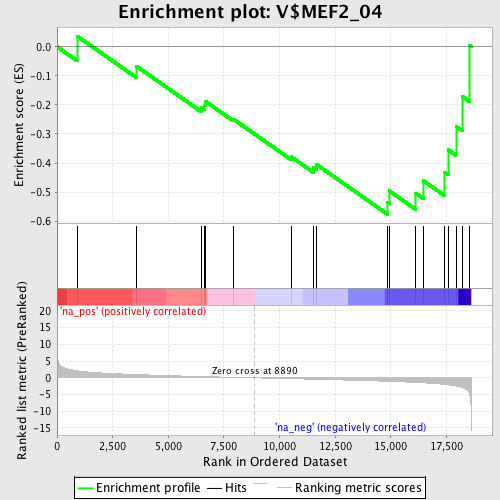
Profile of the Running ES Score & Positions of GeneSet Members on the Rank Ordered List
| Dataset | set04_DMproB_versus_LMproB |
| Phenotype | NoPhenotypeAvailable |
| Upregulated in class | na_neg |
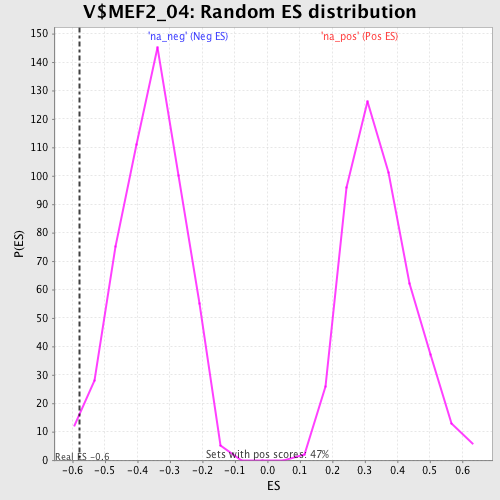
| GeneSet | V$MEF2_04 |
| Enrichment Score (ES) | -0.5769632 |
| Normalized Enrichment Score (NES) | -1.6064857 |
| Nominal p-value | 0.0075329565 |
| FDR q-value | 0.49205127 |
| FWER p-Value | 0.861 |
| PROBE | GENE SYMBOL | GENE_TITLE | RANK IN GENE LIST | RANK METRIC SCORE | RUNNING ES | CORE ENRICHMENT | |
|---|---|---|---|---|---|---|---|
| 1 | NFAT5 | 907 | 2.083 | 0.0366 | No | ||
| 2 | MGST3 | 3584 | 0.967 | -0.0676 | No | ||
| 3 | ADCY2 | 6488 | 0.385 | -0.2079 | No | ||
| 4 | LGI1 | 6646 | 0.364 | -0.2014 | No | ||
| 5 | RAP2C | 6651 | 0.363 | -0.1867 | No | ||
| 6 | NRAP | 7927 | 0.152 | -0.2491 | No | ||
| 7 | NR2F1 | 10524 | -0.246 | -0.3785 | No | ||
| 8 | CYP46A1 | 11523 | -0.411 | -0.4154 | No | ||
| 9 | CTHRC1 | 11675 | -0.436 | -0.4056 | No | ||
| 10 | PPARGC1A | 14863 | -1.028 | -0.5348 | Yes | ||
| 11 | TRPC4 | 14927 | -1.043 | -0.4954 | Yes | ||
| 12 | ASB16 | 16118 | -1.363 | -0.5035 | Yes | ||
| 13 | ELAVL4 | 16464 | -1.492 | -0.4609 | Yes | ||
| 14 | PREP | 17417 | -1.962 | -0.4316 | Yes | ||
| 15 | CUTL1 | 17590 | -2.100 | -0.3548 | Yes | ||
| 16 | SLCO5A1 | 17931 | -2.422 | -0.2738 | Yes | ||
| 17 | EYA1 | 18203 | -2.877 | -0.1704 | Yes | ||
| 18 | RALY | 18536 | -4.695 | 0.0043 | Yes |