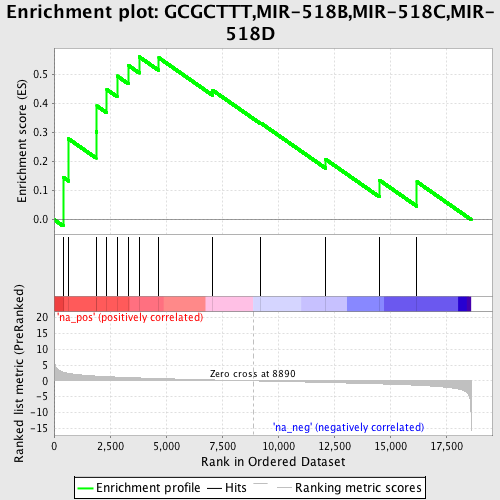
Profile of the Running ES Score & Positions of GeneSet Members on the Rank Ordered List
| Dataset | set04_DMproB_versus_LMproB |
| Phenotype | NoPhenotypeAvailable |
| Upregulated in class | na_pos |
| GeneSet | GCGCTTT,MIR-518B,MIR-518C,MIR-518D |
| Enrichment Score (ES) | 0.55905133 |
| Normalized Enrichment Score (NES) | 1.5180274 |
| Nominal p-value | 0.06315789 |
| FDR q-value | 0.24855427 |
| FWER p-Value | 0.962 |
| PROBE | GENE SYMBOL | GENE_TITLE | RANK IN GENE LIST | RANK METRIC SCORE | RUNNING ES | CORE ENRICHMENT | |
|---|---|---|---|---|---|---|---|
| 1 | AP1G1 | 404 | 2.759 | 0.1454 | Yes | ||
| 2 | NFE2L1 | 647 | 2.394 | 0.2774 | Yes | ||
| 3 | TEAD3 | 1872 | 1.503 | 0.3026 | Yes | ||
| 4 | BRUNOL4 | 1912 | 1.485 | 0.3905 | Yes | ||
| 5 | TSN | 2355 | 1.318 | 0.4466 | Yes | ||
| 6 | OTP | 2813 | 1.179 | 0.4934 | Yes | ||
| 7 | KCNK12 | 3310 | 1.043 | 0.5299 | Yes | ||
| 8 | RAP1B | 3802 | 0.917 | 0.5591 | Yes | ||
| 9 | PTPRU | 4679 | 0.721 | 0.5556 | No | ||
| 10 | HOXC8 | 7067 | 0.290 | 0.4449 | No | ||
| 11 | SOX11 | 9229 | -0.050 | 0.3318 | No | ||
| 12 | HOXA3 | 12126 | -0.508 | 0.2069 | No | ||
| 13 | MCF2L | 14521 | -0.950 | 0.1357 | No | ||
| 14 | NRXN1 | 16198 | -1.393 | 0.1300 | No |
