Profile of the Running ES Score & Positions of GeneSet Members on the Rank Ordered List
| Dataset | set04_DMproB_versus_LMproB |
| Phenotype | NoPhenotypeAvailable |
| Upregulated in class | na_neg |
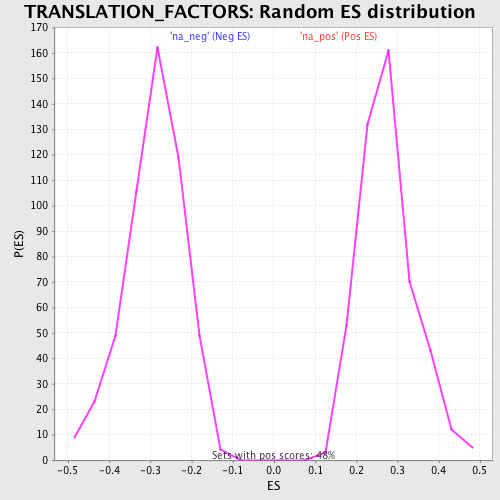
| GeneSet | TRANSLATION_FACTORS |
| Enrichment Score (ES) | -0.5373588 |
| Normalized Enrichment Score (NES) | -1.8507824 |
| Nominal p-value | 0.0 |
| FDR q-value | 0.16579586 |
| FWER p-Value | 0.394 |
| PROBE | GENE SYMBOL | GENE_TITLE | RANK IN GENE LIST | RANK METRIC SCORE | RUNNING ES | CORE ENRICHMENT | |
|---|---|---|---|---|---|---|---|
| 1 | EIF2AK3 | 1218 | 1.851 | -0.0316 | No | ||
| 2 | EIF1AY | 1295 | 1.806 | -0.0025 | No | ||
| 3 | EIF3S1 | 1710 | 1.574 | 0.0041 | No | ||
| 4 | EIF4G3 | 5500 | 0.564 | -0.1895 | No | ||
| 5 | SLC35A4 | 5517 | 0.561 | -0.1801 | No | ||
| 6 | EIF4G1 | 5685 | 0.531 | -0.1793 | No | ||
| 7 | EEF1A2 | 5962 | 0.481 | -0.1853 | No | ||
| 8 | EIF4EBP2 | 6510 | 0.382 | -0.2077 | No | ||
| 9 | GSPT2 | 8266 | 0.100 | -0.3004 | No | ||
| 10 | EIF2AK1 | 8308 | 0.094 | -0.3009 | No | ||
| 11 | EIF2S1 | 9479 | -0.086 | -0.3623 | No | ||
| 12 | EIF3S3 | 9826 | -0.139 | -0.3783 | No | ||
| 13 | EIF2B2 | 10126 | -0.185 | -0.3910 | No | ||
| 14 | ITGB4BP | 11688 | -0.438 | -0.4670 | No | ||
| 15 | EIF5B | 12579 | -0.592 | -0.5041 | No | ||
| 16 | EIF4EBP1 | 12643 | -0.603 | -0.4964 | No | ||
| 17 | EIF2B5 | 12986 | -0.665 | -0.5026 | No | ||
| 18 | EIF3S6 | 13237 | -0.703 | -0.5032 | No | ||
| 19 | EIF2B3 | 13275 | -0.708 | -0.4921 | No | ||
| 20 | EIF5 | 14116 | -0.866 | -0.5215 | Yes | ||
| 21 | EIF4A1 | 14391 | -0.922 | -0.5193 | Yes | ||
| 22 | EIF2AK2 | 14649 | -0.979 | -0.5151 | Yes | ||
| 23 | EIF3S9 | 14696 | -0.988 | -0.4995 | Yes | ||
| 24 | EIF2B4 | 14995 | -1.056 | -0.4961 | Yes | ||
| 25 | EIF3S4 | 15258 | -1.126 | -0.4895 | Yes | ||
| 26 | EIF4E | 15500 | -1.188 | -0.4807 | Yes | ||
| 27 | EIF3S10 | 15635 | -1.219 | -0.4655 | Yes | ||
| 28 | EEF1G | 16181 | -1.386 | -0.4694 | Yes | ||
| 29 | PAIP1 | 16190 | -1.390 | -0.4443 | Yes | ||
| 30 | EIF2B1 | 16282 | -1.421 | -0.4231 | Yes | ||
| 31 | EIF4A2 | 16655 | -1.564 | -0.4144 | Yes | ||
| 32 | ETF1 | 16843 | -1.648 | -0.3942 | Yes | ||
| 33 | EEF1B2 | 16946 | -1.693 | -0.3685 | Yes | ||
| 34 | EEF2 | 17044 | -1.747 | -0.3417 | Yes | ||
| 35 | EIF3S5 | 17265 | -1.878 | -0.3190 | Yes | ||
| 36 | EEF2K | 17460 | -1.998 | -0.2928 | Yes | ||
| 37 | EIF3S7 | 17617 | -2.120 | -0.2622 | Yes | ||
| 38 | EIF3S8 | 17729 | -2.202 | -0.2277 | Yes | ||
| 39 | PABPC1 | 17954 | -2.454 | -0.1947 | Yes | ||
| 40 | EEF1D | 18077 | -2.645 | -0.1527 | Yes | ||
| 41 | EIF2S2 | 18093 | -2.674 | -0.1044 | Yes | ||
| 42 | EIF3S2 | 18315 | -3.160 | -0.0582 | Yes | ||
| 43 | EIF5A | 18481 | -4.050 | 0.0073 | Yes |