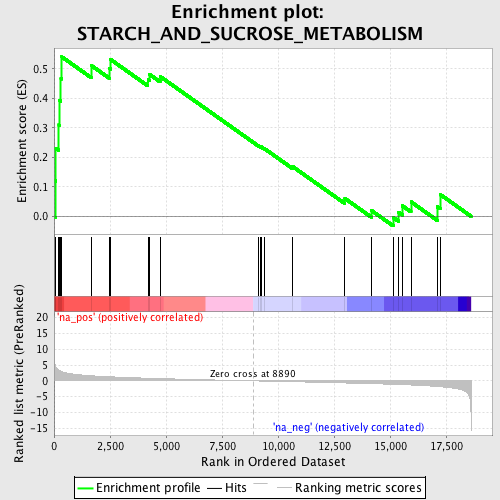
Profile of the Running ES Score & Positions of GeneSet Members on the Rank Ordered List
| Dataset | set04_DMproB_versus_LMproB |
| Phenotype | NoPhenotypeAvailable |
| Upregulated in class | na_pos |
| GeneSet | STARCH_AND_SUCROSE_METABOLISM |
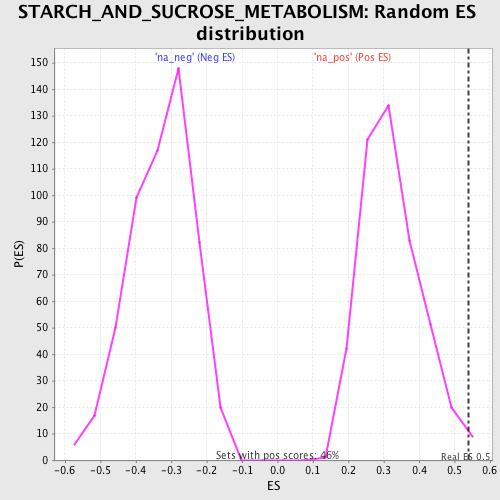
| Enrichment Score (ES) | 0.54055226 |
| Normalized Enrichment Score (NES) | 1.6780084 |
| Nominal p-value | 0.010845987 |
| FDR q-value | 0.18237141 |
| FWER p-Value | 0.937 |

| PROBE | GENE SYMBOL | GENE_TITLE | RANK IN GENE LIST | RANK METRIC SCORE | RUNNING ES | CORE ENRICHMENT | |
|---|---|---|---|---|---|---|---|
| 1 | UGT1A6 | 49 | 4.714 | 0.1204 | Yes | ||
| 2 | UGT1A10 | 74 | 4.271 | 0.2306 | Yes | ||
| 3 | HK3 | 215 | 3.318 | 0.3097 | Yes | ||
| 4 | HK2 | 228 | 3.224 | 0.3932 | Yes | ||
| 5 | PYGL | 305 | 2.991 | 0.4672 | Yes | ||
| 6 | MGAM | 342 | 2.884 | 0.5406 | Yes | ||
| 7 | HK1 | 1672 | 1.591 | 0.5106 | No | ||
| 8 | SI | 2476 | 1.282 | 0.5009 | No | ||
| 9 | PYGB | 2514 | 1.269 | 0.5320 | No | ||
| 10 | ENPP1 | 4191 | 0.829 | 0.4635 | No | ||
| 11 | GCK | 4258 | 0.810 | 0.4811 | No | ||
| 12 | UGDH | 4734 | 0.709 | 0.4741 | No | ||
| 13 | PYGM | 9125 | -0.035 | 0.2389 | No | ||
| 14 | GYS1 | 9227 | -0.050 | 0.2348 | No | ||
| 15 | GYS2 | 9237 | -0.052 | 0.2357 | No | ||
| 16 | PGM1 | 9379 | -0.075 | 0.2300 | No | ||
| 17 | UXS1 | 10634 | -0.265 | 0.1695 | No | ||
| 18 | GAA | 12980 | -0.664 | 0.0607 | No | ||
| 19 | PGM3 | 14162 | -0.875 | 0.0200 | No | ||
| 20 | UCHL3 | 15140 | -1.094 | -0.0040 | No | ||
| 21 | GBE1 | 15378 | -1.157 | 0.0134 | No | ||
| 22 | G6PC | 15549 | -1.202 | 0.0357 | No | ||
| 23 | UCHL1 | 15934 | -1.308 | 0.0492 | No | ||
| 24 | ENPP3 | 17103 | -1.781 | 0.0328 | No | ||
| 25 | GANAB | 17236 | -1.858 | 0.0742 | No |
