Profile of the Running ES Score & Positions of GeneSet Members on the Rank Ordered List
| Dataset | set04_DMproB_versus_LMproB |
| Phenotype | NoPhenotypeAvailable |
| Upregulated in class | na_pos |
| GeneSet | RAC1PATHWAY |
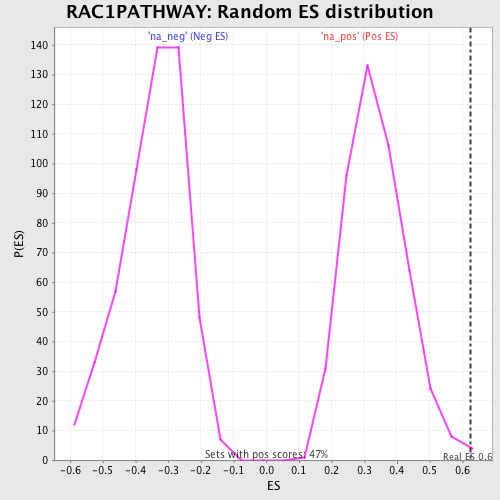
| Enrichment Score (ES) | 0.62522274 |
| Normalized Enrichment Score (NES) | 1.8569365 |
| Nominal p-value | 0.004282655 |
| FDR q-value | 0.11153943 |
| FWER p-Value | 0.427 |
| PROBE | GENE SYMBOL | GENE_TITLE | RANK IN GENE LIST | RANK METRIC SCORE | RUNNING ES | CORE ENRICHMENT | |
|---|---|---|---|---|---|---|---|
| 1 | MYLK | 15 | 7.249 | 0.2317 | Yes | ||
| 2 | NCF2 | 181 | 3.475 | 0.3343 | Yes | ||
| 3 | MYL2 | 222 | 3.278 | 0.4373 | Yes | ||
| 4 | PAK1 | 273 | 3.072 | 0.5331 | Yes | ||
| 5 | CDK5R1 | 320 | 2.949 | 0.6252 | Yes | ||
| 6 | CDK5 | 2244 | 1.359 | 0.5654 | No | ||
| 7 | CFL1 | 3509 | 0.989 | 0.5291 | No | ||
| 8 | PIK3R1 | 6623 | 0.366 | 0.3735 | No | ||
| 9 | PIK3CA | 7419 | 0.232 | 0.3382 | No | ||
| 10 | MAP3K1 | 7470 | 0.224 | 0.3427 | No | ||
| 11 | PDGFRA | 7692 | 0.189 | 0.3369 | No | ||
| 12 | PLD1 | 8841 | 0.009 | 0.2754 | No | ||
| 13 | LIMK1 | 9209 | -0.047 | 0.2572 | No | ||
| 14 | RAC1 | 9785 | -0.132 | 0.2305 | No | ||
| 15 | ARFIP2 | 11813 | -0.457 | 0.1362 | No | ||
| 16 | CHN1 | 14646 | -0.978 | 0.0153 | No | ||
| 17 | RALBP1 | 15601 | -1.214 | 0.0029 | No | ||
| 18 | WASF1 | 15624 | -1.218 | 0.0408 | No | ||
| 19 | RPS6KB1 | 16134 | -1.369 | 0.0573 | No | ||
| 20 | VAV1 | 17890 | -2.372 | 0.0390 | No |