Profile of the Running ES Score & Positions of GeneSet Members on the Rank Ordered List
| Dataset | set04_DMproB_versus_LMproB |
| Phenotype | NoPhenotypeAvailable |
| Upregulated in class | na_pos |
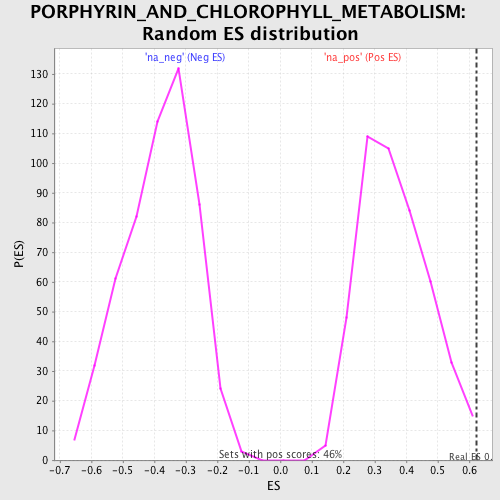
| GeneSet | PORPHYRIN_AND_CHLOROPHYLL_METABOLISM |
| Enrichment Score (ES) | 0.6235373 |
| Normalized Enrichment Score (NES) | 1.7204379 |
| Nominal p-value | 0.008714597 |
| FDR q-value | 0.1938884 |
| FWER p-Value | 0.872 |
| PROBE | GENE SYMBOL | GENE_TITLE | RANK IN GENE LIST | RANK METRIC SCORE | RUNNING ES | CORE ENRICHMENT | |
|---|---|---|---|---|---|---|---|
| 1 | UGT1A6 | 49 | 4.714 | 0.2047 | Yes | ||
| 2 | UGT1A10 | 74 | 4.271 | 0.3913 | Yes | ||
| 3 | HMOX1 | 353 | 2.859 | 0.5021 | Yes | ||
| 4 | PPOX | 388 | 2.803 | 0.6235 | Yes | ||
| 5 | HMBS | 4337 | 0.792 | 0.4461 | No | ||
| 6 | BLVRB | 5016 | 0.656 | 0.4385 | No | ||
| 7 | EPRS | 7578 | 0.207 | 0.3100 | No | ||
| 8 | CPOX | 7755 | 0.181 | 0.3085 | No | ||
| 9 | HMOX2 | 8141 | 0.117 | 0.2929 | No | ||
| 10 | UROD | 9675 | -0.115 | 0.2156 | No | ||
| 11 | BLVRA | 12250 | -0.529 | 0.1005 | No | ||
| 12 | CP | 14524 | -0.951 | 0.0202 | No | ||
| 13 | HCCS | 14896 | -1.035 | 0.0458 | No | ||
| 14 | FECH | 16952 | -1.696 | 0.0099 | No | ||
| 15 | UROS | 17153 | -1.808 | 0.0786 | No |