Profile of the Running ES Score & Positions of GeneSet Members on the Rank Ordered List
| Dataset | set04_DMproB_versus_LMproB |
| Phenotype | NoPhenotypeAvailable |
| Upregulated in class | na_pos |
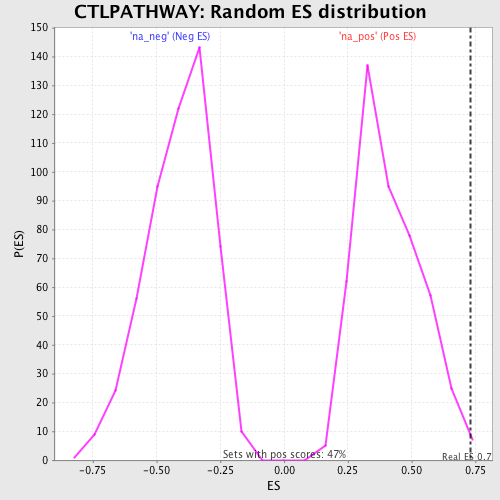
| GeneSet | CTLPATHWAY |
| Enrichment Score (ES) | 0.72979444 |
| Normalized Enrichment Score (NES) | 1.7770787 |
| Nominal p-value | 0.006437768 |
| FDR q-value | 0.14820138 |
| FWER p-Value | 0.702 |
| PROBE | GENE SYMBOL | GENE_TITLE | RANK IN GENE LIST | RANK METRIC SCORE | RUNNING ES | CORE ENRICHMENT | |
|---|---|---|---|---|---|---|---|
| 1 | ITGAL | 56 | 4.531 | 0.3235 | Yes | ||
| 2 | PRF1 | 1027 | 1.991 | 0.4149 | Yes | ||
| 3 | TRB@ | 1032 | 1.987 | 0.5578 | Yes | ||
| 4 | ITGB2 | 1038 | 1.982 | 0.7004 | Yes | ||
| 5 | GZMB | 3308 | 1.043 | 0.6536 | Yes | ||
| 6 | B2M | 3515 | 0.987 | 0.7137 | Yes | ||
| 7 | CD3D | 4290 | 0.801 | 0.7298 | Yes | ||
| 8 | CD3E | 7728 | 0.184 | 0.5583 | No | ||
| 9 | ICAM1 | 9540 | -0.096 | 0.4679 | No | ||
| 10 | CD3G | 10693 | -0.275 | 0.4258 | No |