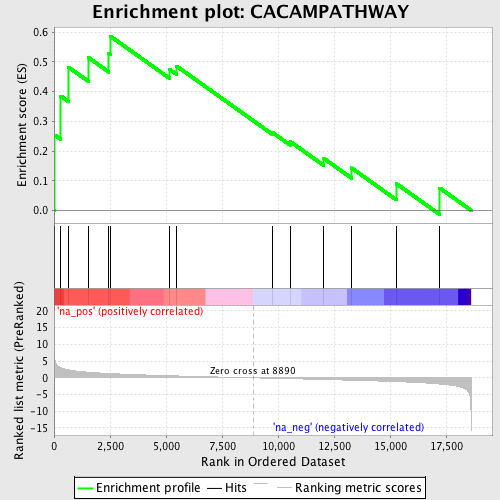
Profile of the Running ES Score & Positions of GeneSet Members on the Rank Ordered List
| Dataset | set04_DMproB_versus_LMproB |
| Phenotype | NoPhenotypeAvailable |
| Upregulated in class | na_pos |
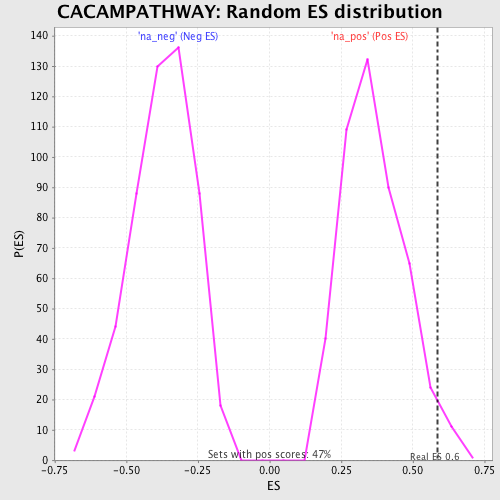
| GeneSet | CACAMPATHWAY |
| Enrichment Score (ES) | 0.5871891 |
| Normalized Enrichment Score (NES) | 1.610538 |
| Nominal p-value | 0.029661017 |
| FDR q-value | 0.2231803 |
| FWER p-Value | 0.992 |
| PROBE | GENE SYMBOL | GENE_TITLE | RANK IN GENE LIST | RANK METRIC SCORE | RUNNING ES | CORE ENRICHMENT | |
|---|---|---|---|---|---|---|---|
| 1 | CAMK1G | 36 | 5.276 | 0.2536 | Yes | ||
| 2 | CREB1 | 297 | 3.010 | 0.3854 | Yes | ||
| 3 | CAMKK2 | 650 | 2.387 | 0.4820 | Yes | ||
| 4 | CAMK2G | 1530 | 1.659 | 0.5151 | Yes | ||
| 5 | SYT1 | 2444 | 1.296 | 0.5288 | Yes | ||
| 6 | CAMK2A | 2506 | 1.273 | 0.5872 | Yes | ||
| 7 | CAMKK1 | 5146 | 0.630 | 0.4758 | No | ||
| 8 | CALM2 | 5471 | 0.570 | 0.4860 | No | ||
| 9 | CAMK2B | 9770 | -0.130 | 0.2612 | No | ||
| 10 | CAMK2D | 10541 | -0.248 | 0.2318 | No | ||
| 11 | CALM3 | 12042 | -0.493 | 0.1751 | No | ||
| 12 | CAMK4 | 13279 | -0.710 | 0.1430 | No | ||
| 13 | CALM1 | 15269 | -1.128 | 0.0907 | No | ||
| 14 | CAMK1 | 17213 | -1.841 | 0.0754 | No |