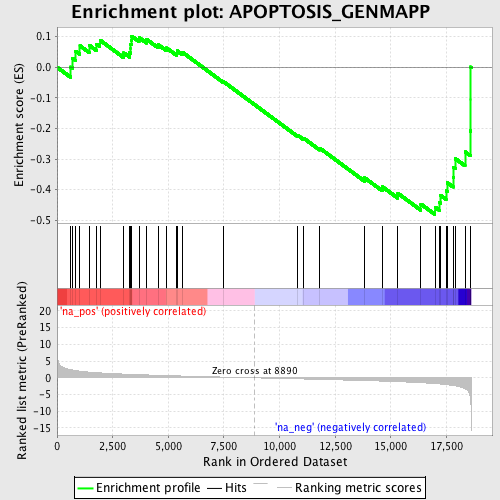
Profile of the Running ES Score & Positions of GeneSet Members on the Rank Ordered List
| Dataset | set04_DMproB_versus_LMproB |
| Phenotype | NoPhenotypeAvailable |
| Upregulated in class | na_neg |
| GeneSet | APOPTOSIS_GENMAPP |
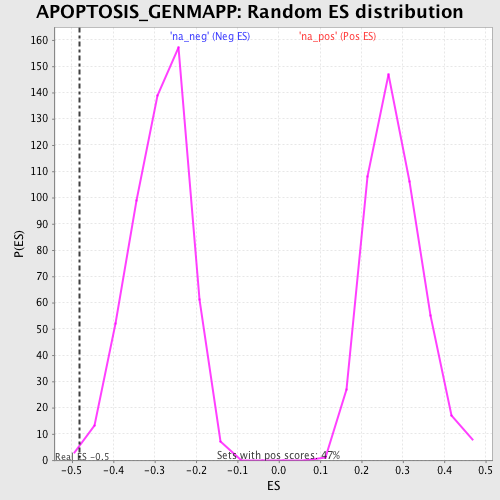
| Enrichment Score (ES) | -0.48131528 |
| Normalized Enrichment Score (NES) | -1.6730433 |
| Nominal p-value | 0.0056497175 |
| FDR q-value | 0.25930312 |
| FWER p-Value | 0.952 |
| PROBE | GENE SYMBOL | GENE_TITLE | RANK IN GENE LIST | RANK METRIC SCORE | RUNNING ES | CORE ENRICHMENT | |
|---|---|---|---|---|---|---|---|
| 1 | IKBKG | 617 | 2.420 | 0.0009 | No | ||
| 2 | TNFRSF1A | 694 | 2.313 | 0.0295 | No | ||
| 3 | TNFRSF1B | 830 | 2.158 | 0.0527 | No | ||
| 4 | PRF1 | 1027 | 1.991 | 0.0702 | No | ||
| 5 | MCL1 | 1442 | 1.712 | 0.0721 | No | ||
| 6 | TRAF1 | 1781 | 1.540 | 0.0757 | No | ||
| 7 | BID | 1927 | 1.480 | 0.0887 | No | ||
| 8 | TNF | 2999 | 1.123 | 0.0469 | No | ||
| 9 | BCL2 | 3260 | 1.054 | 0.0478 | No | ||
| 10 | MAP3K14 | 3303 | 1.045 | 0.0603 | No | ||
| 11 | GZMB | 3308 | 1.043 | 0.0748 | No | ||
| 12 | MYC | 3332 | 1.038 | 0.0882 | No | ||
| 13 | MAPK10 | 3350 | 1.032 | 0.1019 | No | ||
| 14 | MDM2 | 3684 | 0.943 | 0.0973 | No | ||
| 15 | BCL2L1 | 4023 | 0.869 | 0.0913 | No | ||
| 16 | NFKB1 | 4547 | 0.748 | 0.0737 | No | ||
| 17 | BIRC3 | 4919 | 0.675 | 0.0633 | No | ||
| 18 | NFKBIA | 5386 | 0.585 | 0.0465 | No | ||
| 19 | TRAF2 | 5395 | 0.584 | 0.0543 | No | ||
| 20 | MAP2K4 | 5629 | 0.541 | 0.0494 | No | ||
| 21 | MAP3K1 | 7470 | 0.224 | -0.0465 | No | ||
| 22 | CASP2 | 10821 | -0.295 | -0.2227 | No | ||
| 23 | CASP7 | 11076 | -0.339 | -0.2316 | No | ||
| 24 | RELA | 11802 | -0.455 | -0.2642 | No | ||
| 25 | BIRC2 | 13823 | -0.808 | -0.3615 | No | ||
| 26 | CYCS | 14621 | -0.973 | -0.3907 | No | ||
| 27 | CASP9 | 15313 | -1.138 | -0.4118 | No | ||
| 28 | FASLG | 16350 | -1.445 | -0.4472 | No | ||
| 29 | RIPK1 | 16985 | -1.715 | -0.4571 | Yes | ||
| 30 | CASP8 | 17177 | -1.818 | -0.4417 | Yes | ||
| 31 | CASP6 | 17229 | -1.854 | -0.4183 | Yes | ||
| 32 | FAS | 17486 | -2.013 | -0.4037 | Yes | ||
| 33 | BIRC4 | 17536 | -2.050 | -0.3774 | Yes | ||
| 34 | FADD | 17801 | -2.268 | -0.3596 | Yes | ||
| 35 | PARP1 | 17823 | -2.293 | -0.3284 | Yes | ||
| 36 | CASP3 | 17902 | -2.386 | -0.2989 | Yes | ||
| 37 | JUN | 18337 | -3.236 | -0.2766 | Yes | ||
| 38 | TNFSF10 | 18575 | -5.771 | -0.2079 | Yes | ||
| 39 | TP53 | 18597 | -7.392 | -0.1047 | Yes | ||
| 40 | BAX | 18598 | -7.485 | 0.0010 | Yes |