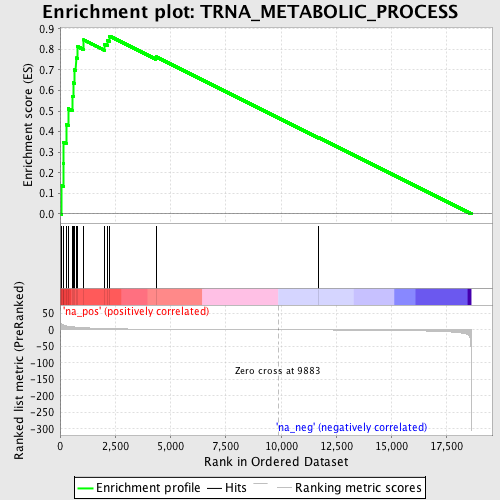
Profile of the Running ES Score & Positions of GeneSet Members on the Rank Ordered List
| Dataset | set04_DMpreB_versus_WTpreB |
| Phenotype | NoPhenotypeAvailable |
| Upregulated in class | na_pos |
| GeneSet | TRNA_METABOLIC_PROCESS |
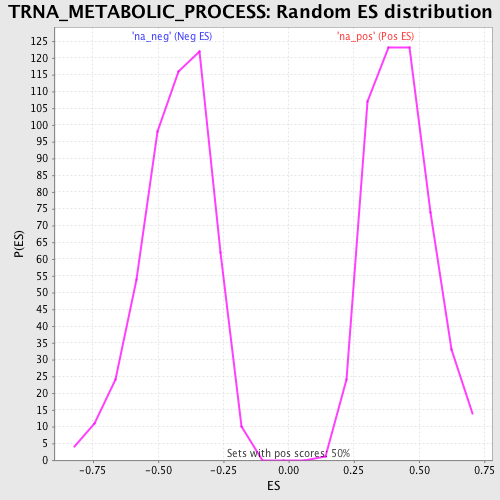
| Enrichment Score (ES) | 0.8647273 |
| Normalized Enrichment Score (NES) | 2.0339458 |
| Nominal p-value | 0.0 |
| FDR q-value | 1.031607E-4 |
| FWER p-Value | 0.0020 |
| PROBE | GENE SYMBOL | GENE_TITLE | RANK IN GENE LIST | RANK METRIC SCORE | RUNNING ES | CORE ENRICHMENT | |
|---|---|---|---|---|---|---|---|
| 1 | RARS | 59 | 18.228 | 0.1388 | Yes | ||
| 2 | KARS | 144 | 14.221 | 0.2450 | Yes | ||
| 3 | METTL1 | 161 | 13.502 | 0.3493 | Yes | ||
| 4 | DARS | 275 | 11.659 | 0.4340 | Yes | ||
| 5 | TRNT1 | 369 | 10.530 | 0.5110 | Yes | ||
| 6 | AARS | 548 | 9.110 | 0.5724 | Yes | ||
| 7 | POP4 | 595 | 8.744 | 0.6380 | Yes | ||
| 8 | NSUN2 | 652 | 8.381 | 0.7002 | Yes | ||
| 9 | ADAT1 | 719 | 7.940 | 0.7585 | Yes | ||
| 10 | POP1 | 790 | 7.536 | 0.8134 | Yes | ||
| 11 | SCYE1 | 1074 | 6.155 | 0.8462 | Yes | ||
| 12 | YARS | 1999 | 3.674 | 0.8251 | Yes | ||
| 13 | WARS | 2146 | 3.413 | 0.8438 | Yes | ||
| 14 | SARS2 | 2232 | 3.272 | 0.8647 | Yes | ||
| 15 | SSB | 4340 | 1.574 | 0.7637 | No | ||
| 16 | FARS2 | 11692 | -0.478 | 0.3722 | No |