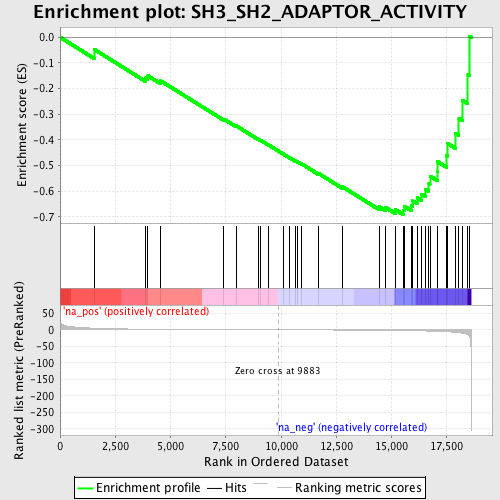
Profile of the Running ES Score & Positions of GeneSet Members on the Rank Ordered List
| Dataset | set04_DMpreB_versus_WTpreB |
| Phenotype | NoPhenotypeAvailable |
| Upregulated in class | na_neg |
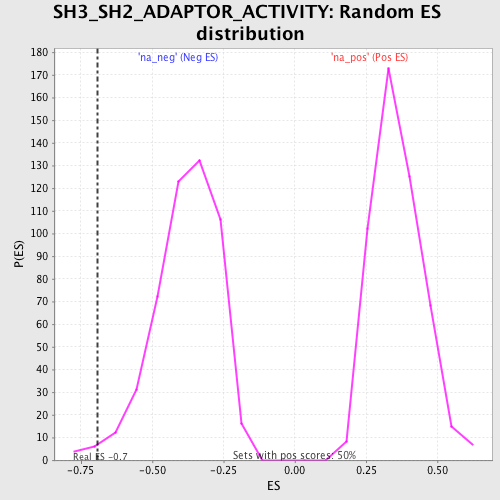
| GeneSet | SH3_SH2_ADAPTOR_ACTIVITY |
| Enrichment Score (ES) | -0.69100666 |
| Normalized Enrichment Score (NES) | -1.8170837 |
| Nominal p-value | 0.0139442235 |
| FDR q-value | 1.0 |
| FWER p-Value | 1.0 |
| PROBE | GENE SYMBOL | GENE_TITLE | RANK IN GENE LIST | RANK METRIC SCORE | RUNNING ES | CORE ENRICHMENT | |
|---|---|---|---|---|---|---|---|
| 1 | SOCS2 | 1557 | 4.606 | -0.0480 | No | ||
| 2 | CNTNAP1 | 3875 | 1.795 | -0.1588 | No | ||
| 3 | SRC | 3975 | 1.750 | -0.1505 | No | ||
| 4 | KHDRBS1 | 4542 | 1.493 | -0.1694 | No | ||
| 5 | GRAP2 | 7413 | 0.614 | -0.3191 | No | ||
| 6 | GRB10 | 7966 | 0.468 | -0.3452 | No | ||
| 7 | ITSN2 | 8967 | 0.222 | -0.3973 | No | ||
| 8 | SHB | 9074 | 0.200 | -0.4014 | No | ||
| 9 | SH3BGR | 9453 | 0.102 | -0.4210 | No | ||
| 10 | SKAP2 | 10095 | -0.055 | -0.4551 | No | ||
| 11 | LAT | 10401 | -0.130 | -0.4705 | No | ||
| 12 | CHN1 | 10631 | -0.188 | -0.4813 | No | ||
| 13 | GRB7 | 10735 | -0.219 | -0.4852 | No | ||
| 14 | CHN2 | 10925 | -0.270 | -0.4932 | No | ||
| 15 | ABI2 | 11698 | -0.481 | -0.5311 | No | ||
| 16 | SNX9 | 12781 | -0.800 | -0.5831 | No | ||
| 17 | GRB14 | 14444 | -1.499 | -0.6609 | No | ||
| 18 | IRS4 | 14736 | -1.655 | -0.6637 | No | ||
| 19 | RUSC1 | 15180 | -1.932 | -0.6725 | No | ||
| 20 | GRAP | 15524 | -2.234 | -0.6737 | Yes | ||
| 21 | ARHGAP1 | 15585 | -2.289 | -0.6591 | Yes | ||
| 22 | SH2D3C | 15912 | -2.632 | -0.6562 | Yes | ||
| 23 | ARHGAP6 | 15966 | -2.700 | -0.6381 | Yes | ||
| 24 | EPS8 | 16156 | -2.924 | -0.6256 | Yes | ||
| 25 | SH3BGRL | 16366 | -3.277 | -0.6114 | Yes | ||
| 26 | SH2D2A | 16533 | -3.627 | -0.5921 | Yes | ||
| 27 | CRKL | 16694 | -3.936 | -0.5702 | Yes | ||
| 28 | STAM | 16742 | -4.057 | -0.5412 | Yes | ||
| 29 | SH3BP2 | 17072 | -4.786 | -0.5217 | Yes | ||
| 30 | BLNK | 17078 | -4.805 | -0.4847 | Yes | ||
| 31 | GRB2 | 17489 | -6.003 | -0.4602 | Yes | ||
| 32 | TOB1 | 17549 | -6.253 | -0.4148 | Yes | ||
| 33 | ARHGAP4 | 17902 | -7.667 | -0.3742 | Yes | ||
| 34 | LASP1 | 18052 | -8.575 | -0.3156 | Yes | ||
| 35 | GAB1 | 18219 | -10.102 | -0.2461 | Yes | ||
| 36 | SLA | 18460 | -14.650 | -0.1452 | Yes | ||
| 37 | VAV3 | 18534 | -19.775 | 0.0044 | Yes |