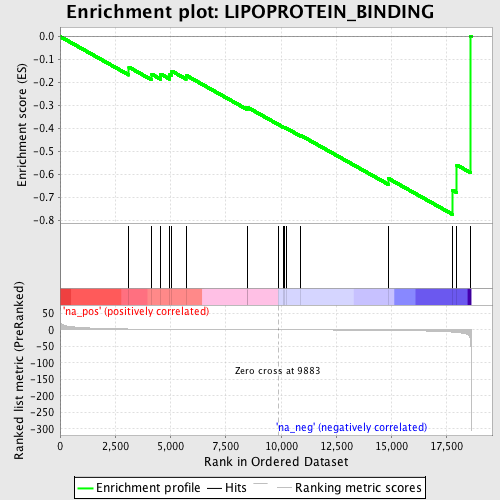
Profile of the Running ES Score & Positions of GeneSet Members on the Rank Ordered List
| Dataset | set04_DMpreB_versus_WTpreB |
| Phenotype | NoPhenotypeAvailable |
| Upregulated in class | na_neg |
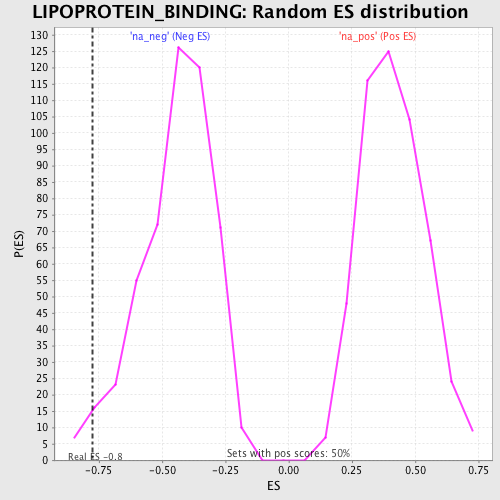
| GeneSet | LIPOPROTEIN_BINDING |
| Enrichment Score (ES) | -0.7736086 |
| Normalized Enrichment Score (NES) | -1.7423109 |
| Nominal p-value | 0.024 |
| FDR q-value | 1.0 |
| FWER p-Value | 1.0 |
| PROBE | GENE SYMBOL | GENE_TITLE | RANK IN GENE LIST | RANK METRIC SCORE | RUNNING ES | CORE ENRICHMENT | |
|---|---|---|---|---|---|---|---|
| 1 | CDH13 | 3114 | 2.278 | -0.1332 | No | ||
| 2 | VLDLR | 4148 | 1.667 | -0.1637 | No | ||
| 3 | APOL2 | 4551 | 1.489 | -0.1630 | No | ||
| 4 | LRP6 | 4965 | 1.336 | -0.1651 | No | ||
| 5 | LDLR | 5049 | 1.302 | -0.1500 | No | ||
| 6 | COLEC12 | 5700 | 1.093 | -0.1686 | No | ||
| 7 | CXCL16 | 8466 | 0.344 | -0.3121 | No | ||
| 8 | STAB2 | 8467 | 0.344 | -0.3069 | No | ||
| 9 | STAB1 | 9869 | 0.003 | -0.3822 | No | ||
| 10 | APOB48R | 10109 | -0.058 | -0.3942 | No | ||
| 11 | ANKRA2 | 10146 | -0.069 | -0.3951 | No | ||
| 12 | LRP1 | 10267 | -0.095 | -0.4001 | No | ||
| 13 | APOA4 | 10887 | -0.259 | -0.4295 | No | ||
| 14 | MAPT | 14864 | -1.723 | -0.6174 | No | ||
| 15 | SORL1 | 17771 | -7.017 | -0.6683 | Yes | ||
| 16 | LRPAP1 | 17956 | -7.966 | -0.5585 | Yes | ||
| 17 | TLR6 | 18585 | -39.562 | 0.0017 | Yes |