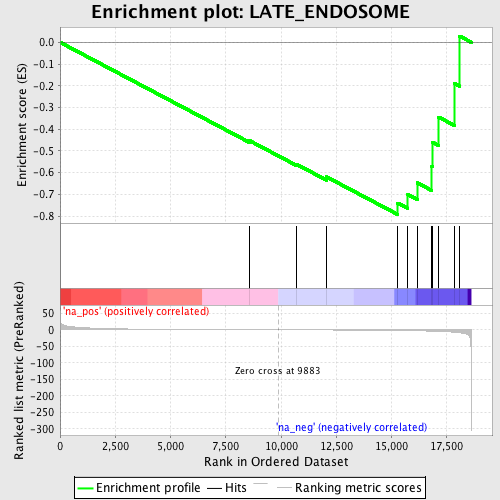
Profile of the Running ES Score & Positions of GeneSet Members on the Rank Ordered List
| Dataset | set04_DMpreB_versus_WTpreB |
| Phenotype | NoPhenotypeAvailable |
| Upregulated in class | na_neg |
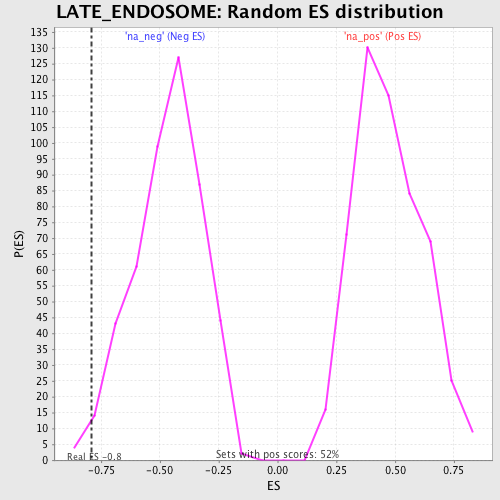
| GeneSet | LATE_ENDOSOME |
| Enrichment Score (ES) | -0.7922903 |
| Normalized Enrichment Score (NES) | -1.699977 |
| Nominal p-value | 0.01871102 |
| FDR q-value | 1.0 |
| FWER p-Value | 1.0 |
| PROBE | GENE SYMBOL | GENE_TITLE | RANK IN GENE LIST | RANK METRIC SCORE | RUNNING ES | CORE ENRICHMENT | |
|---|---|---|---|---|---|---|---|
| 1 | LAMP1 | 8581 | 0.317 | -0.4529 | No | ||
| 2 | TSG101 | 10699 | -0.209 | -0.5612 | No | ||
| 3 | ATP7A | 12058 | -0.574 | -0.6192 | No | ||
| 4 | ATP7B | 15280 | -2.004 | -0.7399 | Yes | ||
| 5 | TPT1 | 15736 | -2.436 | -0.7006 | Yes | ||
| 6 | RAB9A | 16168 | -2.938 | -0.6468 | Yes | ||
| 7 | RAB7A | 16824 | -4.247 | -0.5709 | Yes | ||
| 8 | CD79A | 16865 | -4.314 | -0.4601 | Yes | ||
| 9 | LAMP2 | 17134 | -4.980 | -0.3442 | Yes | ||
| 10 | CTNS | 17848 | -7.370 | -0.1897 | Yes | ||
| 11 | RAB14 | 18083 | -8.824 | 0.0286 | Yes |