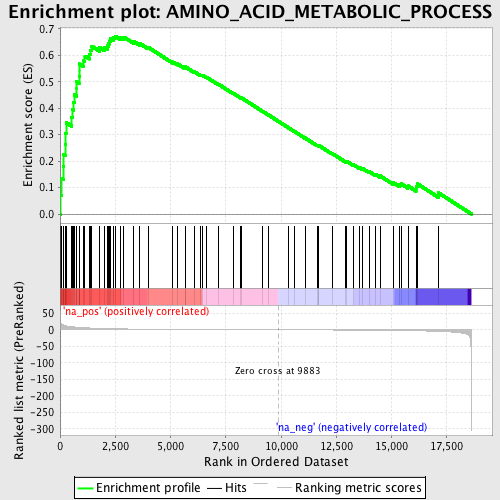
Profile of the Running ES Score & Positions of GeneSet Members on the Rank Ordered List
| Dataset | set04_DMpreB_versus_WTpreB |
| Phenotype | NoPhenotypeAvailable |
| Upregulated in class | na_pos |
| GeneSet | AMINO_ACID_METABOLIC_PROCESS |
| Enrichment Score (ES) | 0.67244434 |
| Normalized Enrichment Score (NES) | 2.12033 |
| Nominal p-value | 0.0 |
| FDR q-value | 0.0 |
| FWER p-Value | 0.0 |
| PROBE | GENE SYMBOL | GENE_TITLE | RANK IN GENE LIST | RANK METRIC SCORE | RUNNING ES | CORE ENRICHMENT | |
|---|---|---|---|---|---|---|---|
| 1 | QDPR | 29 | 20.865 | 0.0717 | Yes | ||
| 2 | RARS | 59 | 18.228 | 0.1342 | Yes | ||
| 3 | KARS | 144 | 14.221 | 0.1796 | Yes | ||
| 4 | GOT2 | 160 | 13.524 | 0.2263 | Yes | ||
| 5 | FPGS | 238 | 12.054 | 0.2645 | Yes | ||
| 6 | ATF4 | 248 | 11.928 | 0.3060 | Yes | ||
| 7 | DARS | 275 | 11.659 | 0.3455 | Yes | ||
| 8 | SLC7A6 | 525 | 9.312 | 0.3648 | Yes | ||
| 9 | AARS | 548 | 9.110 | 0.3956 | Yes | ||
| 10 | BCKDHB | 602 | 8.711 | 0.4234 | Yes | ||
| 11 | SMS | 639 | 8.477 | 0.4512 | Yes | ||
| 12 | SLC25A15 | 745 | 7.772 | 0.4729 | Yes | ||
| 13 | SLC7A5 | 749 | 7.742 | 0.4999 | Yes | ||
| 14 | MCCC2 | 860 | 7.170 | 0.5192 | Yes | ||
| 15 | PYCR1 | 882 | 7.022 | 0.5427 | Yes | ||
| 16 | GCLM | 883 | 7.013 | 0.5673 | Yes | ||
| 17 | SCYE1 | 1074 | 6.155 | 0.5787 | Yes | ||
| 18 | GSTZ1 | 1124 | 5.963 | 0.5970 | Yes | ||
| 19 | ALDH4A1 | 1331 | 5.296 | 0.6045 | Yes | ||
| 20 | BCAT1 | 1384 | 5.100 | 0.6196 | Yes | ||
| 21 | NFS1 | 1432 | 4.963 | 0.6345 | Yes | ||
| 22 | GOT1 | 1789 | 4.075 | 0.6297 | Yes | ||
| 23 | YARS | 1999 | 3.674 | 0.6313 | Yes | ||
| 24 | WARS | 2146 | 3.413 | 0.6354 | Yes | ||
| 25 | SLC6A6 | 2202 | 3.322 | 0.6441 | Yes | ||
| 26 | SARS2 | 2232 | 3.272 | 0.6540 | Yes | ||
| 27 | FAH | 2288 | 3.177 | 0.6622 | Yes | ||
| 28 | GSS | 2417 | 2.993 | 0.6659 | Yes | ||
| 29 | GAD1 | 2486 | 2.920 | 0.6724 | Yes | ||
| 30 | HGD | 2722 | 2.635 | 0.6690 | No | ||
| 31 | SDS | 2886 | 2.485 | 0.6690 | No | ||
| 32 | ASL | 3321 | 2.128 | 0.6530 | No | ||
| 33 | SLC7A8 | 3602 | 1.944 | 0.6448 | No | ||
| 34 | INDO | 3981 | 1.748 | 0.6305 | No | ||
| 35 | BAAT | 5098 | 1.289 | 0.5749 | No | ||
| 36 | BCKDK | 5315 | 1.217 | 0.5675 | No | ||
| 37 | CDO1 | 5655 | 1.109 | 0.5531 | No | ||
| 38 | MAT2B | 5673 | 1.101 | 0.5561 | No | ||
| 39 | SLC7A2 | 6073 | 0.982 | 0.5380 | No | ||
| 40 | GLDC | 6370 | 0.890 | 0.5252 | No | ||
| 41 | MSRA | 6435 | 0.871 | 0.5248 | No | ||
| 42 | PTS | 6627 | 0.816 | 0.5174 | No | ||
| 43 | MTHFR | 7172 | 0.681 | 0.4904 | No | ||
| 44 | DCT | 7849 | 0.496 | 0.4557 | No | ||
| 45 | HDC | 8174 | 0.416 | 0.4397 | No | ||
| 46 | SLC6A14 | 8189 | 0.412 | 0.4404 | No | ||
| 47 | GGTLA1 | 9150 | 0.183 | 0.3893 | No | ||
| 48 | BCKDHA | 9452 | 0.102 | 0.3734 | No | ||
| 49 | ARG1 | 10337 | -0.113 | 0.3262 | No | ||
| 50 | SLC3A1 | 10598 | -0.178 | 0.3128 | No | ||
| 51 | DDAH1 | 11083 | -0.317 | 0.2878 | No | ||
| 52 | ALDH18A1 | 11640 | -0.468 | 0.2594 | No | ||
| 53 | FARS2 | 11692 | -0.478 | 0.2584 | No | ||
| 54 | HPD | 11693 | -0.479 | 0.2600 | No | ||
| 55 | PAH | 12307 | -0.651 | 0.2293 | No | ||
| 56 | GGT1 | 12923 | -0.845 | 0.1991 | No | ||
| 57 | GLUD1 | 12970 | -0.862 | 0.1996 | No | ||
| 58 | TYR | 13276 | -0.974 | 0.1866 | No | ||
| 59 | AMT | 13555 | -1.087 | 0.1754 | No | ||
| 60 | SLC7A7 | 13680 | -1.127 | 0.1727 | No | ||
| 61 | SLC7A4 | 13986 | -1.260 | 0.1607 | No | ||
| 62 | MAT1A | 14262 | -1.398 | 0.1508 | No | ||
| 63 | SLC7A9 | 14481 | -1.519 | 0.1444 | No | ||
| 64 | ASPA | 15085 | -1.872 | 0.1184 | No | ||
| 65 | PLOD1 | 15368 | -2.079 | 0.1105 | No | ||
| 66 | SCLY | 15435 | -2.146 | 0.1145 | No | ||
| 67 | ASRGL1 | 15745 | -2.445 | 0.1064 | No | ||
| 68 | GCLC | 16109 | -2.874 | 0.0970 | No | ||
| 69 | DDAH2 | 16144 | -2.907 | 0.1053 | No | ||
| 70 | GAD2 | 16175 | -2.956 | 0.1141 | No | ||
| 71 | ALDH6A1 | 17130 | -4.971 | 0.0801 | No |