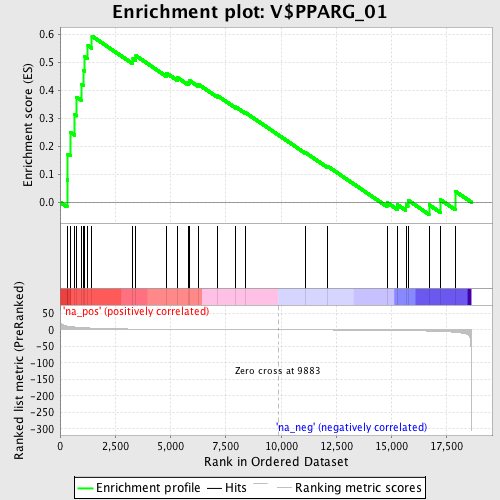
Profile of the Running ES Score & Positions of GeneSet Members on the Rank Ordered List
| Dataset | set04_DMpreB_versus_WTpreB |
| Phenotype | NoPhenotypeAvailable |
| Upregulated in class | na_pos |
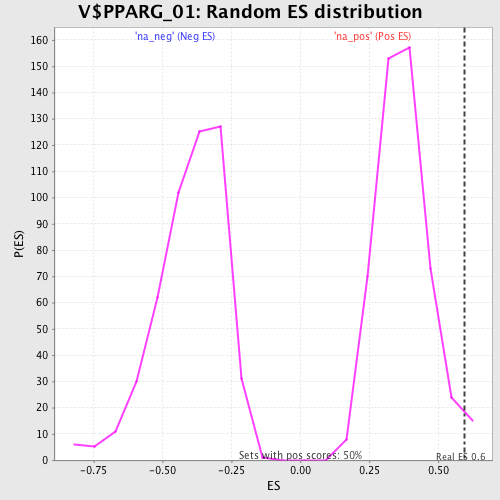
| GeneSet | V$PPARG_01 |
| Enrichment Score (ES) | 0.5945788 |
| Normalized Enrichment Score (NES) | 1.5904766 |
| Nominal p-value | 0.03 |
| FDR q-value | 0.052154753 |
| FWER p-Value | 0.746 |
| PROBE | GENE SYMBOL | GENE_TITLE | RANK IN GENE LIST | RANK METRIC SCORE | RUNNING ES | CORE ENRICHMENT | |
|---|---|---|---|---|---|---|---|
| 1 | SNRPF | 315 | 11.120 | 0.0803 | Yes | ||
| 2 | SFRS6 | 352 | 10.664 | 0.1716 | Yes | ||
| 3 | RQCD1 | 462 | 9.734 | 0.2509 | Yes | ||
| 4 | SMYD5 | 665 | 8.314 | 0.3127 | Yes | ||
| 5 | MAGMAS | 742 | 7.781 | 0.3766 | Yes | ||
| 6 | NR2F6 | 985 | 6.532 | 0.4207 | Yes | ||
| 7 | DNAJA2 | 1063 | 6.224 | 0.4710 | Yes | ||
| 8 | MRPS28 | 1119 | 5.975 | 0.5203 | Yes | ||
| 9 | EEF1B2 | 1259 | 5.530 | 0.5612 | Yes | ||
| 10 | USP37 | 1442 | 4.939 | 0.5946 | Yes | ||
| 11 | NR2C1 | 3296 | 2.147 | 0.5137 | No | ||
| 12 | GRPEL1 | 3431 | 2.053 | 0.5244 | No | ||
| 13 | PRRX2 | 4818 | 1.388 | 0.4620 | No | ||
| 14 | PAX7 | 5311 | 1.218 | 0.4462 | No | ||
| 15 | NDUFS1 | 5802 | 1.062 | 0.4291 | No | ||
| 16 | ZIC4 | 5868 | 1.044 | 0.4347 | No | ||
| 17 | GPR124 | 6243 | 0.929 | 0.4227 | No | ||
| 18 | CNTFR | 7130 | 0.689 | 0.3811 | No | ||
| 19 | SYT6 | 7952 | 0.471 | 0.3410 | No | ||
| 20 | RPL27 | 8386 | 0.365 | 0.3209 | No | ||
| 21 | APOM | 11098 | -0.320 | 0.1779 | No | ||
| 22 | GOLGA4 | 12109 | -0.590 | 0.1287 | No | ||
| 23 | PPARGC1A | 14798 | -1.685 | -0.0012 | No | ||
| 24 | AGPS | 15256 | -1.980 | -0.0084 | No | ||
| 25 | HSD17B8 | 15655 | -2.360 | -0.0092 | No | ||
| 26 | PAK4 | 15747 | -2.448 | 0.0073 | No | ||
| 27 | AP1B1 | 16699 | -3.951 | -0.0093 | No | ||
| 28 | ZSWIM3 | 17222 | -5.253 | 0.0085 | No | ||
| 29 | ESRRA | 17890 | -7.595 | 0.0391 | No |