Profile of the Running ES Score & Positions of GeneSet Members on the Rank Ordered List
| Dataset | set04_DMpreB_versus_WTpreB |
| Phenotype | NoPhenotypeAvailable |
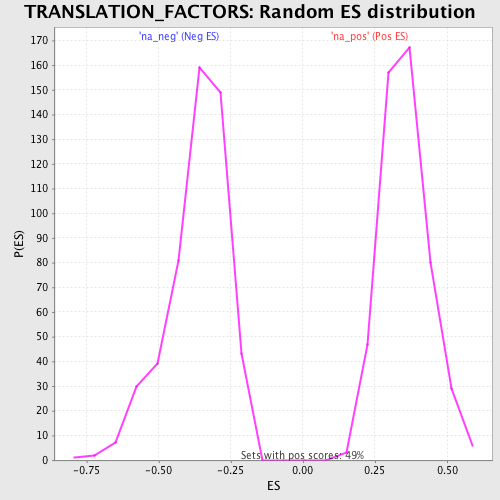
| Upregulated in class | na_pos |
| GeneSet | TRANSLATION_FACTORS |
| Enrichment Score (ES) | 0.7019346 |
| Normalized Enrichment Score (NES) | 1.994529 |
| Nominal p-value | 0.0 |
| FDR q-value | 3.831636E-4 |
| FWER p-Value | 0.0040 |
| PROBE | GENE SYMBOL | GENE_TITLE | RANK IN GENE LIST | RANK METRIC SCORE | RUNNING ES | CORE ENRICHMENT | |
|---|---|---|---|---|---|---|---|
| 1 | EIF3S2 | 16 | 24.955 | 0.0940 | Yes | ||
| 2 | EIF2B3 | 63 | 18.159 | 0.1605 | Yes | ||
| 3 | EIF2S2 | 90 | 16.078 | 0.2202 | Yes | ||
| 4 | EIF3S9 | 180 | 13.030 | 0.2650 | Yes | ||
| 5 | EIF2B5 | 212 | 12.482 | 0.3107 | Yes | ||
| 6 | EEF1D | 307 | 11.210 | 0.3483 | Yes | ||
| 7 | EEF1G | 318 | 11.097 | 0.3899 | Yes | ||
| 8 | EIF2B1 | 332 | 10.931 | 0.4308 | Yes | ||
| 9 | ETF1 | 378 | 10.464 | 0.4681 | Yes | ||
| 10 | EIF5A | 422 | 10.060 | 0.5040 | Yes | ||
| 11 | EIF4E | 663 | 8.322 | 0.5227 | Yes | ||
| 12 | EIF3S4 | 818 | 7.411 | 0.5426 | Yes | ||
| 13 | EIF4A1 | 819 | 7.405 | 0.5707 | Yes | ||
| 14 | EIF3S7 | 965 | 6.665 | 0.5883 | Yes | ||
| 15 | EIF3S10 | 1075 | 6.154 | 0.6058 | Yes | ||
| 16 | EEF1B2 | 1259 | 5.530 | 0.6170 | Yes | ||
| 17 | EIF3S8 | 1273 | 5.492 | 0.6371 | Yes | ||
| 18 | EIF2B4 | 1475 | 4.820 | 0.6446 | Yes | ||
| 19 | PABPC1 | 1592 | 4.530 | 0.6556 | Yes | ||
| 20 | EIF4G1 | 1615 | 4.467 | 0.6714 | Yes | ||
| 21 | EIF2AK2 | 1617 | 4.465 | 0.6883 | Yes | ||
| 22 | EIF1AY | 1705 | 4.278 | 0.6999 | Yes | ||
| 23 | ITGB4BP | 2150 | 3.405 | 0.6889 | Yes | ||
| 24 | EIF3S6 | 2174 | 3.370 | 0.7005 | Yes | ||
| 25 | EIF3S1 | 2409 | 3.006 | 0.6993 | Yes | ||
| 26 | EIF5 | 2561 | 2.827 | 0.7019 | Yes | ||
| 27 | SLC35A4 | 3229 | 2.200 | 0.6744 | No | ||
| 28 | EEF1A2 | 3313 | 2.133 | 0.6780 | No | ||
| 29 | EIF2S1 | 3611 | 1.939 | 0.6694 | No | ||
| 30 | EIF3S3 | 4896 | 1.357 | 0.6054 | No | ||
| 31 | EIF2B2 | 6654 | 0.812 | 0.5139 | No | ||
| 32 | PAIP1 | 9231 | 0.164 | 0.3759 | No | ||
| 33 | GSPT2 | 9369 | 0.126 | 0.3690 | No | ||
| 34 | EIF2AK1 | 12392 | -0.679 | 0.2088 | No | ||
| 35 | EEF2K | 13563 | -1.090 | 0.1500 | No | ||
| 36 | EIF5B | 14229 | -1.380 | 0.1194 | No | ||
| 37 | EIF3S5 | 15506 | -2.211 | 0.0591 | No | ||
| 38 | EIF4G3 | 15532 | -2.244 | 0.0663 | No | ||
| 39 | EEF2 | 16333 | -3.240 | 0.0356 | No | ||
| 40 | EIF4A2 | 16383 | -3.305 | 0.0455 | No | ||
| 41 | EIF4EBP2 | 16524 | -3.613 | 0.0517 | No | ||
| 42 | EIF2AK3 | 17278 | -5.421 | 0.0317 | No | ||
| 43 | EIF4EBP1 | 18280 | -10.587 | 0.0181 | No |