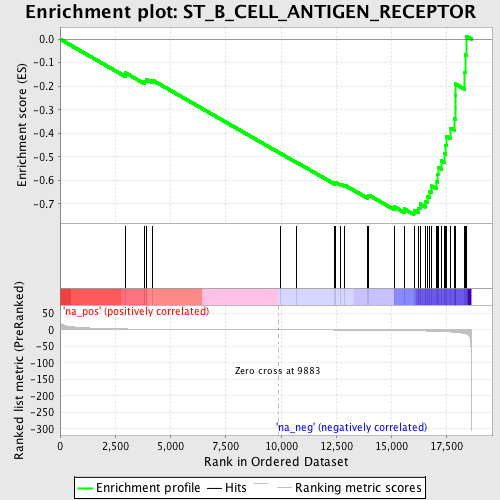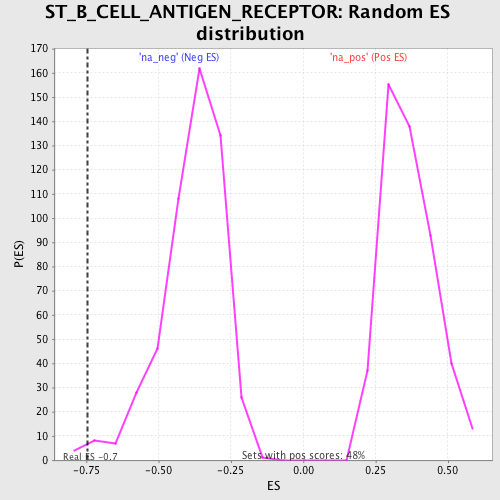
Profile of the Running ES Score & Positions of GeneSet Members on the Rank Ordered List
| Dataset | set04_DMpreB_versus_WTpreB |
| Phenotype | NoPhenotypeAvailable |
| Upregulated in class | na_neg |
| GeneSet | ST_B_CELL_ANTIGEN_RECEPTOR |
| Enrichment Score (ES) | -0.74488634 |
| Normalized Enrichment Score (NES) | -1.9406132 |
| Nominal p-value | 0.007633588 |
| FDR q-value | 0.26523036 |
| FWER p-Value | 0.676 |

| PROBE | GENE SYMBOL | GENE_TITLE | RANK IN GENE LIST | RANK METRIC SCORE | RUNNING ES | CORE ENRICHMENT | |
|---|---|---|---|---|---|---|---|
| 1 | AKT1 | 2954 | 2.432 | -0.1429 | No | ||
| 2 | PPP1R13B | 3832 | 1.820 | -0.1780 | No | ||
| 3 | ITPKA | 3905 | 1.781 | -0.1701 | No | ||
| 4 | SHC1 | 4178 | 1.653 | -0.1738 | No | ||
| 5 | NFKB2 | 9984 | -0.028 | -0.4860 | No | ||
| 6 | LYN | 10706 | -0.211 | -0.5234 | No | ||
| 7 | MAP2K2 | 12431 | -0.690 | -0.6116 | No | ||
| 8 | MAP2K1 | 12474 | -0.704 | -0.6092 | No | ||
| 9 | SOS1 | 12695 | -0.778 | -0.6159 | No | ||
| 10 | PIK3R1 | 12882 | -0.833 | -0.6204 | No | ||
| 11 | NFKBIB | 13906 | -1.223 | -0.6674 | No | ||
| 12 | EPHB2 | 13966 | -1.251 | -0.6623 | No | ||
| 13 | DAG1 | 15125 | -1.898 | -0.7120 | No | ||
| 14 | PIK3CA | 15572 | -2.276 | -0.7209 | No | ||
| 15 | NFAT5 | 16018 | -2.763 | -0.7266 | Yes | ||
| 16 | RAF1 | 16233 | -3.067 | -0.7178 | Yes | ||
| 17 | NFKBIL1 | 16291 | -3.169 | -0.6999 | Yes | ||
| 18 | CD19 | 16540 | -3.644 | -0.6891 | Yes | ||
| 19 | BAD | 16608 | -3.779 | -0.6677 | Yes | ||
| 20 | ITPKB | 16731 | -4.043 | -0.6474 | Yes | ||
| 21 | PIK3CD | 16811 | -4.218 | -0.6238 | Yes | ||
| 22 | SOS2 | 17023 | -4.655 | -0.6043 | Yes | ||
| 23 | BLNK | 17078 | -4.805 | -0.5754 | Yes | ||
| 24 | BTK | 17106 | -4.910 | -0.5443 | Yes | ||
| 25 | MAPK1 | 17264 | -5.380 | -0.5171 | Yes | ||
| 26 | NFKB1 | 17383 | -5.733 | -0.4855 | Yes | ||
| 27 | AKT3 | 17454 | -5.931 | -0.4500 | Yes | ||
| 28 | GRB2 | 17489 | -6.003 | -0.4121 | Yes | ||
| 29 | PLCG2 | 17677 | -6.671 | -0.3779 | Yes | ||
| 30 | AKT2 | 17832 | -7.269 | -0.3381 | Yes | ||
| 31 | NFKBIA | 17884 | -7.579 | -0.2906 | Yes | ||
| 32 | BCR | 17885 | -7.586 | -0.2404 | Yes | ||
| 33 | NFKBIE | 17895 | -7.630 | -0.1903 | Yes | ||
| 34 | VAV1 | 18300 | -10.774 | -0.1407 | Yes | ||
| 35 | CSK | 18344 | -11.494 | -0.0669 | Yes | ||
| 36 | SYK | 18377 | -12.306 | 0.0129 | Yes |
