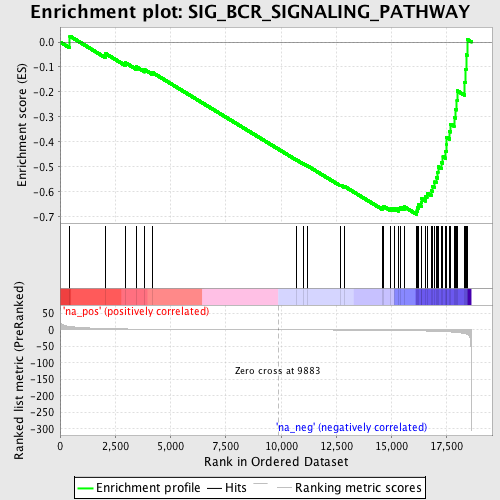
Profile of the Running ES Score & Positions of GeneSet Members on the Rank Ordered List
| Dataset | set04_DMpreB_versus_WTpreB |
| Phenotype | NoPhenotypeAvailable |
| Upregulated in class | na_neg |
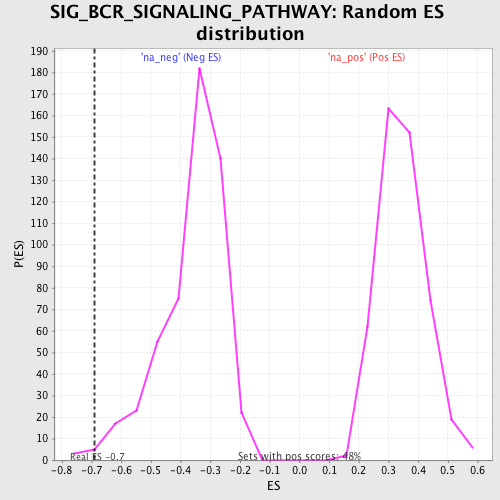
| GeneSet | SIG_BCR_SIGNALING_PATHWAY |
| Enrichment Score (ES) | -0.6904887 |
| Normalized Enrichment Score (NES) | -1.9126383 |
| Nominal p-value | 0.007662835 |
| FDR q-value | 0.2779552 |
| FWER p-Value | 0.756 |
| PROBE | GENE SYMBOL | GENE_TITLE | RANK IN GENE LIST | RANK METRIC SCORE | RUNNING ES | CORE ENRICHMENT | |
|---|---|---|---|---|---|---|---|
| 1 | PDK1 | 442 | 9.880 | 0.0236 | No | ||
| 2 | BCL2 | 2046 | 3.584 | -0.0455 | No | ||
| 3 | AKT1 | 2954 | 2.432 | -0.0827 | No | ||
| 4 | FLOT2 | 3444 | 2.044 | -0.0992 | No | ||
| 5 | PPP1R13B | 3832 | 1.820 | -0.1113 | No | ||
| 6 | SHC1 | 4178 | 1.653 | -0.1220 | No | ||
| 7 | LYN | 10706 | -0.211 | -0.4724 | No | ||
| 8 | NR0B2 | 10999 | -0.288 | -0.4868 | No | ||
| 9 | NFATC2 | 11197 | -0.344 | -0.4957 | No | ||
| 10 | SOS1 | 12695 | -0.778 | -0.5726 | No | ||
| 11 | PIK3R1 | 12882 | -0.833 | -0.5786 | No | ||
| 12 | GSK3A | 14577 | -1.570 | -0.6623 | No | ||
| 13 | ITPR3 | 14626 | -1.593 | -0.6572 | No | ||
| 14 | PPP3CA | 14970 | -1.793 | -0.6671 | No | ||
| 15 | DAG1 | 15125 | -1.898 | -0.6663 | No | ||
| 16 | CR2 | 15325 | -2.041 | -0.6672 | No | ||
| 17 | ITPR1 | 15399 | -2.111 | -0.6610 | No | ||
| 18 | PIK3CA | 15572 | -2.276 | -0.6594 | No | ||
| 19 | MAP4K1 | 16151 | -2.914 | -0.6765 | Yes | ||
| 20 | ITPR2 | 16186 | -2.985 | -0.6640 | Yes | ||
| 21 | RAF1 | 16233 | -3.067 | -0.6518 | Yes | ||
| 22 | PPP3CB | 16355 | -3.264 | -0.6426 | Yes | ||
| 23 | PPP3CC | 16365 | -3.277 | -0.6274 | Yes | ||
| 24 | CD19 | 16540 | -3.644 | -0.6193 | Yes | ||
| 25 | BAD | 16608 | -3.779 | -0.6048 | Yes | ||
| 26 | PIK3CD | 16811 | -4.218 | -0.5954 | Yes | ||
| 27 | INPP5D | 16846 | -4.291 | -0.5766 | Yes | ||
| 28 | PTPRC | 16945 | -4.513 | -0.5603 | Yes | ||
| 29 | SOS2 | 17023 | -4.655 | -0.5421 | Yes | ||
| 30 | BLNK | 17078 | -4.805 | -0.5219 | Yes | ||
| 31 | BTK | 17106 | -4.910 | -0.4998 | Yes | ||
| 32 | MAPK1 | 17264 | -5.380 | -0.4825 | Yes | ||
| 33 | GSK3B | 17328 | -5.538 | -0.4593 | Yes | ||
| 34 | AKT3 | 17454 | -5.931 | -0.4376 | Yes | ||
| 35 | GRB2 | 17489 | -6.003 | -0.4106 | Yes | ||
| 36 | MAPK3 | 17495 | -6.022 | -0.3820 | Yes | ||
| 37 | FLOT1 | 17629 | -6.522 | -0.3579 | Yes | ||
| 38 | PLCG2 | 17677 | -6.671 | -0.3284 | Yes | ||
| 39 | AKT2 | 17832 | -7.269 | -0.3018 | Yes | ||
| 40 | BCR | 17885 | -7.586 | -0.2682 | Yes | ||
| 41 | CD81 | 17961 | -7.995 | -0.2339 | Yes | ||
| 42 | CD22 | 17979 | -8.180 | -0.1956 | Yes | ||
| 43 | VAV1 | 18300 | -10.774 | -0.1611 | Yes | ||
| 44 | CSK | 18344 | -11.494 | -0.1083 | Yes | ||
| 45 | SYK | 18377 | -12.306 | -0.0510 | Yes | ||
| 46 | NFATC1 | 18423 | -13.291 | 0.0104 | Yes |