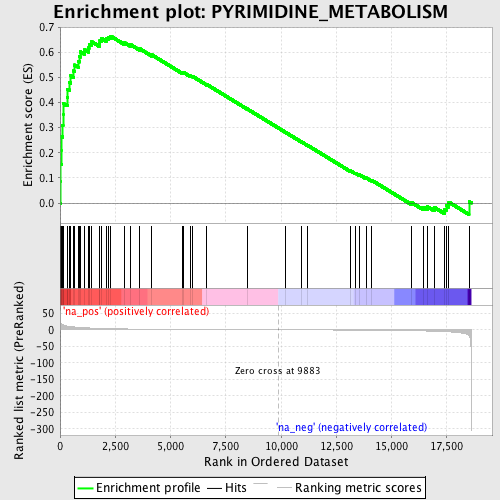
Profile of the Running ES Score & Positions of GeneSet Members on the Rank Ordered List
| Dataset | set04_DMpreB_versus_WTpreB |
| Phenotype | NoPhenotypeAvailable |
| Upregulated in class | na_pos |
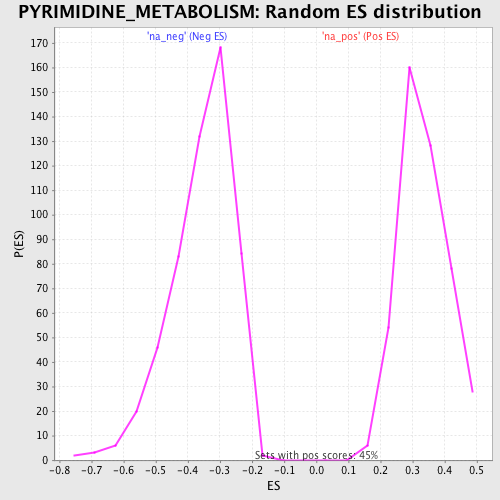
| GeneSet | PYRIMIDINE_METABOLISM |
| Enrichment Score (ES) | 0.6645043 |
| Normalized Enrichment Score (NES) | 1.9931054 |
| Nominal p-value | 0.0 |
| FDR q-value | 3.4484724E-4 |
| FWER p-Value | 0.0040 |
| PROBE | GENE SYMBOL | GENE_TITLE | RANK IN GENE LIST | RANK METRIC SCORE | RUNNING ES | CORE ENRICHMENT | |
|---|---|---|---|---|---|---|---|
| 1 | POLR1B | 14 | 28.191 | 0.0864 | Yes | ||
| 2 | DCTD | 21 | 22.383 | 0.1552 | Yes | ||
| 3 | CTPS | 61 | 18.222 | 0.2094 | Yes | ||
| 4 | NME2 | 66 | 17.853 | 0.2644 | Yes | ||
| 5 | NME1 | 107 | 15.161 | 0.3091 | Yes | ||
| 6 | POLD2 | 133 | 14.463 | 0.3525 | Yes | ||
| 7 | CAD | 139 | 14.296 | 0.3964 | Yes | ||
| 8 | POLE | 321 | 11.089 | 0.4209 | Yes | ||
| 9 | UNG | 340 | 10.863 | 0.4535 | Yes | ||
| 10 | POLR2J | 428 | 9.986 | 0.4797 | Yes | ||
| 11 | POLR2H | 482 | 9.582 | 0.5064 | Yes | ||
| 12 | TYMS | 615 | 8.624 | 0.5260 | Yes | ||
| 13 | UMPS | 656 | 8.363 | 0.5497 | Yes | ||
| 14 | NUDT2 | 821 | 7.395 | 0.5637 | Yes | ||
| 15 | DHODH | 865 | 7.147 | 0.5835 | Yes | ||
| 16 | TK1 | 910 | 6.911 | 0.6025 | Yes | ||
| 17 | POLR2E | 1117 | 5.985 | 0.6099 | Yes | ||
| 18 | POLR2K | 1286 | 5.454 | 0.6177 | Yes | ||
| 19 | RRM1 | 1310 | 5.381 | 0.6331 | Yes | ||
| 20 | POLL | 1431 | 4.964 | 0.6419 | Yes | ||
| 21 | DTYMK | 1781 | 4.087 | 0.6358 | Yes | ||
| 22 | UCK1 | 1800 | 4.056 | 0.6473 | Yes | ||
| 23 | POLR2A | 1865 | 3.916 | 0.6560 | Yes | ||
| 24 | POLG | 2085 | 3.516 | 0.6551 | Yes | ||
| 25 | POLR2I | 2179 | 3.359 | 0.6604 | Yes | ||
| 26 | NT5E | 2287 | 3.179 | 0.6645 | Yes | ||
| 27 | AK3L1 | 2925 | 2.453 | 0.6378 | No | ||
| 28 | ECGF1 | 3175 | 2.229 | 0.6313 | No | ||
| 29 | TXNRD1 | 3605 | 1.942 | 0.6141 | No | ||
| 30 | ENTPD1 | 4154 | 1.666 | 0.5898 | No | ||
| 31 | NP | 5532 | 1.149 | 0.5192 | No | ||
| 32 | POLR2G | 5592 | 1.130 | 0.5195 | No | ||
| 33 | DPYD | 5900 | 1.034 | 0.5061 | No | ||
| 34 | POLRMT | 5985 | 1.011 | 0.5047 | No | ||
| 35 | POLQ | 6646 | 0.813 | 0.4717 | No | ||
| 36 | UPP1 | 8464 | 0.344 | 0.3749 | No | ||
| 37 | ITPA | 10186 | -0.075 | 0.2824 | No | ||
| 38 | POLS | 10909 | -0.263 | 0.2443 | No | ||
| 39 | CDA | 11198 | -0.344 | 0.2299 | No | ||
| 40 | POLR2C | 13132 | -0.928 | 0.1286 | No | ||
| 41 | DPYS | 13369 | -1.006 | 0.1190 | No | ||
| 42 | UPB1 | 13554 | -1.087 | 0.1125 | No | ||
| 43 | POLR2B | 13857 | -1.203 | 0.0999 | No | ||
| 44 | CANT1 | 14089 | -1.313 | 0.0915 | No | ||
| 45 | NT5C | 15902 | -2.618 | 0.0020 | No | ||
| 46 | POLB | 16443 | -3.444 | -0.0164 | No | ||
| 47 | NT5M | 16618 | -3.790 | -0.0141 | No | ||
| 48 | CTPS2 | 16938 | -4.495 | -0.0174 | No | ||
| 49 | RRM2 | 17403 | -5.780 | -0.0245 | No | ||
| 50 | POLD1 | 17475 | -5.968 | -0.0099 | No | ||
| 51 | DCK | 17594 | -6.389 | 0.0035 | No | ||
| 52 | TK2 | 18507 | -16.654 | 0.0059 | No |